
 Login Sign Up


| |||||
 |  | ||||

| 12Stocks.com Market Intelligence |
Best China Stocks
|
On this page, you will find the most comprehensive analysis of Chinese stocks and ETFs - from latest trends to performances to charts ➞. First, here are the year-to-date (YTD) performances of the most requested China stocks at 12Stocks.com (click stock for review):
| New Oriental 16% | ||
| Sohu.com 11% | ||
| NetEase 0% | ||
| Alibaba -11% | ||
| JD.com -12% | ||
| Vipshop -15% | ||
| JOYY -19% | ||
| Baidu -20% | ||
| Weibo -28% | ||
| In a hurry? China Stocks Lists: Performance Trends Table, Stock Charts
Sort China stocks: Daily, Weekly, Year-to-Date, Market Cap & Trends. Filter China stocks list by sector: Show all, Tech, Finance, Energy, Staples, Retail, Industrial, Materials, Utilities and HealthCare Filter China stocks list by size: All China Large Medium Small and MicroCap |
| April 19, 2024 - 12Stocks.com China Stocks Performances & Trends Daily | |||||||||
|
|  The overall Smart Investing & Trading Score is 74 (0-bearish to 100-bullish) which puts China index in short term neutral to bullish trend. The Smart Investing & Trading Score from previous trading session is 73 and hence an improvement of trend.
| ||||||||
| Here are the Smart Investing & Trading Scores of the most requested China stocks at 12Stocks.com (click stock name for detailed review): |


| 12Stocks.com: Top Performing China Index Stocks | ||||||||||||||||||||||||||||||||||||||||||||||||
 The top performing China Index stocks year to date are
Now, more recently, over last week, the top performing China Index stocks on the move are


|
||||||||||||||||||||||||||||||||||||||||||||||||
| 12Stocks.com: Investing in China Index with Stocks | |
|
The following table helps investors and traders sort through current performance and trends (as measured by Smart Investing & Trading Score) of various
stocks in the China Index. Quick View: Move mouse or cursor over stock symbol (ticker) to view short-term technical chart and over stock name to view long term chart. Click on  to add stock symbol to your watchlist and to add stock symbol to your watchlist and  to view watchlist. Click on any ticker or stock name for detailed market intelligence report for that stock. to view watchlist. Click on any ticker or stock name for detailed market intelligence report for that stock. |
12Stocks.com Performance of Stocks in China Index
| Ticker | Stock Name | Watchlist | Category | Recent Price | Smart Investing & Trading Score | Change % | YTD Change% |
| NTES | NetEase |   | Technology | 93.50 | 32 | 1.08% | 0.36% |
| APM | Aptorum | | Health Care | 5.90 | 43 | 5.55% | 140.95% |
| HOLI | Hollysys Automation | | Industrials | 24.55 | 31 | 0.97% | -6.85% |
| BABA | Alibaba | | Services & Goods | 69.07 | 10 | 0.28% | -10.89% |
| CMCM | Cheetah Mobile | | Technology | 3.54 | 51 | 5.04% | 55.26% |
| FANH | Fanhua | | Financials | 3.57 | 32 | 4.69% | -46.32% |
| STG | Sunlands | | Services & Goods | 8.16 | 10 | 1.94% | -19.71% |
| HYW | Hywin | | Financials | 0.96 | 52 | 17.78% | -48.11% |
| MSC | Studio City | | Services & Goods | 7.49 | 73 | 1.89% | 15.59% |
| BEDU | Bright Scholar | | Services & Goods | 2.01 | 90 | 6.91% | 60.80% |
| HCM | Hutchison China | | Health Care | 16.49 | 31 | 0.79% | -8.95% |
| LANV | Lanvin | | Services & Goods | 1.55 | 59 | 8.39% | -49.35% |
| MOGU | MOGU | | Services & Goods | 1.99 | 27 | 5.85% | 4.19% |
| YMM | Full Truck | | Technology | 7.72 | 93 | 1.38% | 10.44% |
| JFIN | Jiayin | | Technology | 6.45 | 58 | 1.49% | 24.52% |
| GHG | GreenTree Hospitality | | Services & Goods | 2.83 | 10 | 3.43% | -24.63% |
| SOHU | Sohu.com | | Technology | 10.99 | 66 | 0.73% | 10.67% |
| QSG | QuantaSing | | Consumer Staples | 3.52 | 42 | 2.18% | 117.28% |
| LU | Lufax Holding | | Financials | 4.35 | 83 | 1.87% | 41.69% |
| ICG | Intchains | | Technology | 8.17 | 42 | 0.86% | -33.58% |
| SFWL | Shengfeng Development | | Industrials | 1.65 | 17 | 3.77% | -40.00% |
| JD | JD.com | | Technology | 25.51 | 61 | 0.20% | -11.70% |
| DDL | Dingdong (Cayman) | | Consumer Staples | 1.18 | 30 | 4.91% | -22.70% |
| YGMZ | MingZhu Logistics | | Industrials | 0.47 | 74 | 10.31% | -0.55% |
| OCFT | OneConnect Financial | | Technology | 1.89 | 10 | 2.16% | -40.00% |
| For chart view version of above stock list: Chart View ➞ 0 - 25 , 25 - 50 , 50 - 75 , 75 - 100 , 100 - 125 , 125 - 150 | ||
 | Click To Change The Sort Order: By Market Cap or Company Size Performance: Year-to-date, Week and Day |  |
|
Get the most comprehensive stock market coverage daily at 12Stocks.com ➞ Best Stocks Today ➞ Best Stocks Weekly ➞ Best Stocks Year-to-Date ➞ Best Stocks Trends ➞  Best Stocks Today 12Stocks.com Best Nasdaq Stocks ➞ Best S&P 500 Stocks ➞ Best Tech Stocks ➞ Best Biotech Stocks ➞ |
| Detailed Overview of China Stocks |
| China Technical Overview, Leaders & Laggards, Top China ETF Funds & Detailed China Stocks List, Charts, Trends & More |
| China: Technical Analysis, Trends & YTD Performance | |
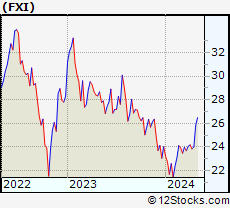
 FXI Weekly Chart |
|
| Long Term Trend: Very Good | |
| Medium Term Trend: Not Good | |
 FXI Daily Chart |
|
| Short Term Trend: Very Good | |
| Overall Trend Score: 74 | |
| YTD Performance: -0.08% | |
| **Trend Scores & Views Are Only For Educational Purposes And Not For Investing | |
| 12Stocks.com: Investing in China Index using Exchange Traded Funds | |
|
The following table shows list of key exchange traded funds (ETF) that
help investors play China stock market. For detailed view, check out our ETF Funds section of our website. Quick View: Move mouse or cursor over ETF symbol (ticker) to view short-term technical chart and over ETF name to view long term chart. Click on ticker or stock name for detailed view. Click on to add stock symbol to your watchlist and to view watchlist. |
12Stocks.com List of ETFs that track China Index
| Ticker | ETF Name | Watchlist | Recent Price | Smart Investing & Trading Score | Change % | Week % | Year-to-date % |
| FXI | China Large-Cap | | 24.01 | 74 | -0.29 | 0.71 | -0.08% |
| EWH | Hong Kong | | 14.70 | 10 | -0.27 | -3.03 | -15.37% |
| YINN | China Bull 3X | | 18.77 | 66 | -0.21 | 2.07 | -10.36% |
| YANG | China Bear 3X | | 11.67 | 39 | 0.78 | -1.85 | -8.83% |
| XPP | China 50 | | 12.90 | 73 | -0.69 | 0.94 | -6.15% |
| MCHI | China | | 39.41 | 59 | -0.33 | 0.33 | -3.26% |
| GXC | China | | 65.19 | 59 | -0.50 | 0.18 | -4.3% |
| CBON | ChinaAMC China Bond | | 21.93 | 60 | 0.05 | 0.3 | -0.79% |
| 12Stocks.com: Charts, Trends, Fundamental Data and Performances of China Stocks | |
|
We now take in-depth look at all China stocks including charts, multi-period performances and overall trends (as measured by Smart Investing & Trading Score). One can sort China stocks (click link to choose) by Daily, Weekly and by Year-to-Date performances. Also, one can sort by size of the company or by market capitalization. |
| Select Your Default Chart Type: | |||||
| |||||
| Click on stock symbol or name for detailed view. Click on to add stock symbol to your watchlist and to view watchlist. Quick View: Move mouse or cursor over "Daily" to quickly view daily technical stock chart and over "Weekly" to view weekly technical stock chart. | |||||

 | NTES NetEase, Inc. |
| Sector: Technology | |
| SubSector: Internet Software & Services | |
| MarketCap: 40105.1 Millions | |
| Recent Price: 93.50 Smart Investing & Trading Score: 32 | |
| Day Percent Change: 1.08% Day Change: 1.00 | |
| Week Change: 1.47% Year-to-date Change: 0.4% | |
| NTES Links: Profile News Message Board | |
| Charts:- Daily , Weekly | |
| Add NTES to Watchlist: View: Get Complete NTES Trend Analysis ➞ | |
 | APM Aptorum Group Limited |
| Sector: Health Care | |
| SubSector: Biotechnology | |
| MarketCap: 88.7785 Millions | |
| Recent Price: 5.90 Smart Investing & Trading Score: 43 | |
| Day Percent Change: 5.55% Day Change: 0.31 | |
| Week Change: -28.14% Year-to-date Change: 141.0% | |
| APM Links: Profile News Message Board | |
| Charts:- Daily , Weekly | |
| Add APM to Watchlist: View: Get Complete APM Trend Analysis ➞ | |
 | HOLI Hollysys Automation Technologies Ltd. |
| Sector: Industrials | |
| SubSector: Industrial Electrical Equipment | |
| MarketCap: 668.379 Millions | |
| Recent Price: 24.55 Smart Investing & Trading Score: 31 | |
| Day Percent Change: 0.97% Day Change: 0.24 | |
| Week Change: -3.33% Year-to-date Change: -6.9% | |
| HOLI Links: Profile News Message Board | |
| Charts:- Daily , Weekly | |
| Add HOLI to Watchlist: View: Get Complete HOLI Trend Analysis ➞ | |
 | BABA Alibaba Group Holding Limited |
| Sector: Services & Goods | |
| SubSector: Specialty Retail, Other | |
| MarketCap: 522666 Millions | |
| Recent Price: 69.07 Smart Investing & Trading Score: 10 | |
| Day Percent Change: 0.28% Day Change: 0.19 | |
| Week Change: -3.11% Year-to-date Change: -10.9% | |
| BABA Links: Profile News Message Board | |
| Charts:- Daily , Weekly | |
| Add BABA to Watchlist: View: Get Complete BABA Trend Analysis ➞ | |
 | CMCM Cheetah Mobile Inc. |
| Sector: Technology | |
| SubSector: Application Software | |
| MarketCap: 343.362 Millions | |
| Recent Price: 3.54 Smart Investing & Trading Score: 51 | |
| Day Percent Change: 5.04% Day Change: 0.17 | |
| Week Change: -23.21% Year-to-date Change: 55.3% | |
| CMCM Links: Profile News Message Board | |
| Charts:- Daily , Weekly | |
| Add CMCM to Watchlist: View: Get Complete CMCM Trend Analysis ➞ | |
 | FANH Fanhua Inc. |
| Sector: Financials | |
| SubSector: Insurance Brokers | |
| MarketCap: 1436.67 Millions | |
| Recent Price: 3.57 Smart Investing & Trading Score: 32 | |
| Day Percent Change: 4.69% Day Change: 0.16 | |
| Week Change: -14.18% Year-to-date Change: -46.3% | |
| FANH Links: Profile News Message Board | |
| Charts:- Daily , Weekly | |
| Add FANH to Watchlist: View: Get Complete FANH Trend Analysis ➞ | |
 | STG Sunlands Technology Group |
| Sector: Services & Goods | |
| SubSector: Education & Training Services | |
| MarketCap: 295.706 Millions | |
| Recent Price: 8.16 Smart Investing & Trading Score: 10 | |
| Day Percent Change: 1.94% Day Change: 0.15 | |
| Week Change: -7.02% Year-to-date Change: -19.7% | |
| STG Links: Profile News Message Board | |
| Charts:- Daily , Weekly | |
| Add STG to Watchlist: View: Get Complete STG Trend Analysis ➞ | |
 | HYW Hywin Holdings Ltd. |
| Sector: Financials | |
| SubSector: Asset Management | |
| MarketCap: 161 Millions | |
| Recent Price: 0.96 Smart Investing & Trading Score: 52 | |
| Day Percent Change: 17.78% Day Change: 0.14 | |
| Week Change: -2.05% Year-to-date Change: -48.1% | |
| HYW Links: Profile News Message Board | |
| Charts:- Daily , Weekly | |
| Add HYW to Watchlist: View: Get Complete HYW Trend Analysis ➞ | |
 | MSC Studio City International Holdings Limited |
| Sector: Services & Goods | |
| SubSector: Resorts & Casinos | |
| MarketCap: 1420.54 Millions | |
| Recent Price: 7.49 Smart Investing & Trading Score: 73 | |
| Day Percent Change: 1.89% Day Change: 0.14 | |
| Week Change: -11.88% Year-to-date Change: 15.6% | |
| MSC Links: Profile News Message Board | |
| Charts:- Daily , Weekly | |
| Add MSC to Watchlist: View: Get Complete MSC Trend Analysis ➞ | |
 | BEDU Bright Scholar Education Holdings Limited |
| Sector: Services & Goods | |
| SubSector: Education & Training Services | |
| MarketCap: 792.406 Millions | |
| Recent Price: 2.01 Smart Investing & Trading Score: 90 | |
| Day Percent Change: 6.91% Day Change: 0.13 | |
| Week Change: 9.24% Year-to-date Change: 60.8% | |
| BEDU Links: Profile News Message Board | |
| Charts:- Daily , Weekly | |
| Add BEDU to Watchlist: View: Get Complete BEDU Trend Analysis ➞ | |
 | HCM Hutchison China MediTech Limited |
| Sector: Health Care | |
| SubSector: Drug Manufacturers - Major | |
| MarketCap: 2324.43 Millions | |
| Recent Price: 16.49 Smart Investing & Trading Score: 31 | |
| Day Percent Change: 0.79% Day Change: 0.13 | |
| Week Change: -7.77% Year-to-date Change: -9.0% | |
| HCM Links: Profile News Message Board | |
| Charts:- Daily , Weekly | |
| Add HCM to Watchlist: View: Get Complete HCM Trend Analysis ➞ | |
 | LANV Lanvin Group Holdings Limited |
| Sector: Services & Goods | |
| SubSector: Luxury Goods | |
| MarketCap: 712 Millions | |
| Recent Price: 1.55 Smart Investing & Trading Score: 59 | |
| Day Percent Change: 8.39% Day Change: 0.12 | |
| Week Change: -3.13% Year-to-date Change: -49.4% | |
| LANV Links: Profile News Message Board | |
| Charts:- Daily , Weekly | |
| Add LANV to Watchlist: View: Get Complete LANV Trend Analysis ➞ | |
 | MOGU MOGU Inc. |
| Sector: Services & Goods | |
| SubSector: Specialty Retail, Other | |
| MarketCap: 168.844 Millions | |
| Recent Price: 1.99 Smart Investing & Trading Score: 27 | |
| Day Percent Change: 5.85% Day Change: 0.11 | |
| Week Change: 1.02% Year-to-date Change: 4.2% | |
| MOGU Links: Profile News Message Board | |
| Charts:- Daily , Weekly | |
| Add MOGU to Watchlist: View: Get Complete MOGU Trend Analysis ➞ | |
 | YMM Full Truck Alliance Co. Ltd. |
| Sector: Technology | |
| SubSector: Software - Application | |
| MarketCap: 6960 Millions | |
| Recent Price: 7.72 Smart Investing & Trading Score: 93 | |
| Day Percent Change: 1.38% Day Change: 0.10 | |
| Week Change: 0.19% Year-to-date Change: 10.4% | |
| YMM Links: Profile News Message Board | |
| Charts:- Daily , Weekly | |
| Add YMM to Watchlist: View: Get Complete YMM Trend Analysis ➞ | |
 | JFIN Jiayin Group Inc. |
| Sector: Technology | |
| SubSector: Internet Information Providers | |
| MarketCap: 131.48 Millions | |
| Recent Price: 6.45 Smart Investing & Trading Score: 58 | |
| Day Percent Change: 1.49% Day Change: 0.09 | |
| Week Change: -0.15% Year-to-date Change: 24.5% | |
| JFIN Links: Profile News Message Board | |
| Charts:- Daily , Weekly | |
| Add JFIN to Watchlist: View: Get Complete JFIN Trend Analysis ➞ | |
 | GHG GreenTree Hospitality Group Ltd. |
| Sector: Services & Goods | |
| SubSector: Lodging | |
| MarketCap: 1195.36 Millions | |
| Recent Price: 2.83 Smart Investing & Trading Score: 10 | |
| Day Percent Change: 3.43% Day Change: 0.09 | |
| Week Change: -7.39% Year-to-date Change: -24.6% | |
| GHG Links: Profile News Message Board | |
| Charts:- Daily , Weekly | |
| Add GHG to Watchlist: View: Get Complete GHG Trend Analysis ➞ | |
 | SOHU Sohu.com Limited |
| Sector: Technology | |
| SubSector: Internet Information Providers | |
| MarketCap: 243.48 Millions | |
| Recent Price: 10.99 Smart Investing & Trading Score: 66 | |
| Day Percent Change: 0.73% Day Change: 0.08 | |
| Week Change: -3.85% Year-to-date Change: 10.7% | |
| SOHU Links: Profile News Message Board | |
| Charts:- Daily , Weekly | |
| Add SOHU to Watchlist: View: Get Complete SOHU Trend Analysis ➞ | |
 | QSG QuantaSing Group Limited |
| Sector: Consumer Staples | |
| SubSector: Education & Training Services | |
| MarketCap: 433 Millions | |
| Recent Price: 3.52 Smart Investing & Trading Score: 42 | |
| Day Percent Change: 2.18% Day Change: 0.08 | |
| Week Change: 4.76% Year-to-date Change: 117.3% | |
| QSG Links: Profile News Message Board | |
| Charts:- Daily , Weekly | |
| Add QSG to Watchlist: View: Get Complete QSG Trend Analysis ➞ | |
 | LU Lufax Holding Ltd |
| Sector: Financials | |
| SubSector: Credit Services | |
| MarketCap: 33457 Millions | |
| Recent Price: 4.35 Smart Investing & Trading Score: 83 | |
| Day Percent Change: 1.87% Day Change: 0.08 | |
| Week Change: 5.07% Year-to-date Change: 41.7% | |
| LU Links: Profile News Message Board | |
| Charts:- Daily , Weekly | |
| Add LU to Watchlist: View: Get Complete LU Trend Analysis ➞ | |
 | ICG Intchains Group Limited |
| Sector: Technology | |
| SubSector: Semiconductors | |
| MarketCap: 450 Millions | |
| Recent Price: 8.17 Smart Investing & Trading Score: 42 | |
| Day Percent Change: 0.86% Day Change: 0.07 | |
| Week Change: -0.97% Year-to-date Change: -33.6% | |
| ICG Links: Profile News Message Board | |
| Charts:- Daily , Weekly | |
| Add ICG to Watchlist: View: Get Complete ICG Trend Analysis ➞ | |
 | SFWL Shengfeng Development Limited |
| Sector: Industrials | |
| SubSector: Integrated Freight & Logistics | |
| MarketCap: 747 Millions | |
| Recent Price: 1.65 Smart Investing & Trading Score: 17 | |
| Day Percent Change: 3.77% Day Change: 0.06 | |
| Week Change: -8.33% Year-to-date Change: -40.0% | |
| SFWL Links: Profile News Message Board | |
| Charts:- Daily , Weekly | |
| Add SFWL to Watchlist: View: Get Complete SFWL Trend Analysis ➞ | |
 | JD JD.com, Inc. |
| Sector: Technology | |
| SubSector: Internet Information Providers | |
| MarketCap: 59907.3 Millions | |
| Recent Price: 25.51 Smart Investing & Trading Score: 61 | |
| Day Percent Change: 0.20% Day Change: 0.05 | |
| Week Change: 0.47% Year-to-date Change: -11.7% | |
| JD Links: Profile News Message Board | |
| Charts:- Daily , Weekly | |
| Add JD to Watchlist: View: Get Complete JD Trend Analysis ➞ | |
 | DDL Dingdong (Cayman) Limited |
| Sector: Consumer Staples | |
| SubSector: Grocery Stores | |
| MarketCap: 708 Millions | |
| Recent Price: 1.18 Smart Investing & Trading Score: 30 | |
| Day Percent Change: 4.91% Day Change: 0.05 | |
| Week Change: -2.89% Year-to-date Change: -22.7% | |
| DDL Links: Profile News Message Board | |
| Charts:- Daily , Weekly | |
| Add DDL to Watchlist: View: Get Complete DDL Trend Analysis ➞ | |
 | YGMZ MingZhu Logistics Holdings Limited |
| Sector: Industrials | |
| SubSector: Trucking | |
| MarketCap: 41627 Millions | |
| Recent Price: 0.47 Smart Investing & Trading Score: 74 | |
| Day Percent Change: 10.31% Day Change: 0.04 | |
| Week Change: 17.48% Year-to-date Change: -0.6% | |
| YGMZ Links: Profile News Message Board | |
| Charts:- Daily , Weekly | |
| Add YGMZ to Watchlist: View: Get Complete YGMZ Trend Analysis ➞ | |
 | OCFT OneConnect Financial Technology Co., Ltd. |
| Sector: Technology | |
| SubSector: Software Application | |
| MarketCap: 80387 Millions | |
| Recent Price: 1.89 Smart Investing & Trading Score: 10 | |
| Day Percent Change: 2.16% Day Change: 0.04 | |
| Week Change: -3.08% Year-to-date Change: -40.0% | |
| OCFT Links: Profile News Message Board | |
| Charts:- Daily , Weekly | |
| Add OCFT to Watchlist: View: Get Complete OCFT Trend Analysis ➞ | |
| For tabular summary view of above stock list: Summary View ➞ 0 - 25 , 25 - 50 , 50 - 75 , 75 - 100 , 100 - 125 , 125 - 150 | ||
| Click To Change The Sort Order: By Market Cap or Company Size Performance: Year-to-date, Week and Day | |
| Select Chart Type: | ||
|
Best Stocks Today 12Stocks.com |
© 2024 12Stocks.com Terms & Conditions Privacy Contact Us
All Information Provided Only For Education And Not To Be Used For Investing or Trading. See Terms & Conditions


One More Thing ... Get Best Stocks Delivered Daily!
Never Ever Miss A Move With Our Top Ten Stocks Lists
Find Best Stocks In Any Market - Bull or Bear Market
Take A Peek At Our Top Ten Stocks Lists: Daily, Weekly, Year-to-Date & Top Trends
Find Best Stocks In Any Market - Bull or Bear Market
Take A Peek At Our Top Ten Stocks Lists: Daily, Weekly, Year-to-Date & Top Trends
China Stocks With Best Up Trends [0-bearish to 100-bullish]: Full Truck[93], Bright Scholar[90], DouYu [90], GDS [88], GigaCloud [88], Smart Share[86], Lufax Holding[83], So-Young [83], U Power[76], Yatsen Holding[76], MingZhu Logistics[74]
Best China Stocks Year-to-Date:
U Power[2812.95%], DouYu [747.37%], MicroCloud Hologram[664.03%], China Liberal[476.51%], Zhongchao [412.19%], Yatsen Holding[394.12%], Uxin [141.08%], QuantaSing [117.28%], GigaCloud [95.49%], Bright Scholar[60.8%], Cheetah Mobile[55.26%] Best China Stocks This Week:
Regencell Bioscience[37.01%], Yatsen Holding[20.1%], MingZhu Logistics[17.48%], Secoo Holding[17.14%], Zhongchao [14.02%], TH [10%], Smart Share[9.26%], Bright Scholar[9.24%], Quhuo [8.87%], DouYu [6.62%], China Liberal[6.27%] Best China Stocks Daily:
Hywin [17.78%], MingZhu Logistics[10.31%], Lanvin [8.39%], Bright Scholar[6.91%], MOGU [5.85%], Cheetah Mobile[5.04%], Dingdong (Cayman)[4.91%], Secoo Holding[4.75%], Fanhua [4.69%], Shengfeng Development[3.77%], Burning Rock[3.52%]