
 Login Sign Up


| |||||
 |  | ||||

| 12Stocks.com Market Intelligence |
Best China Stocks
|
On this page, you will find the most comprehensive analysis of Chinese stocks and ETFs - from latest trends to performances to charts ➞. First, here are the year-to-date (YTD) performances of the most requested China stocks at 12Stocks.com (click stock for review):
| New Oriental 16% | ||
| Sohu.com 10% | ||
| NetEase 0% | ||
| Alibaba -11% | ||
| JD.com -12% | ||
| Vipshop -15% | ||
| JOYY -19% | ||
| Baidu -20% | ||
| Weibo -28% | ||
| In a hurry? China Stocks Lists: Performance Trends Table, Stock Charts
Sort China stocks: Daily, Weekly, Year-to-Date, Market Cap & Trends. Filter China stocks list by sector: Show all, Tech, Finance, Energy, Staples, Retail, Industrial, Materials, Utilities and HealthCare Filter China stocks list by size: All China Large Medium Small and MicroCap |
| April 20, 2024 - 12Stocks.com China Stocks Performances & Trends Daily | |||||||||
|
|  The overall Smart Investing & Trading Score is 74 (0-bearish to 100-bullish) which puts China index in short term neutral to bullish trend. The Smart Investing & Trading Score from previous trading session is 73 and hence an improvement of trend.
| ||||||||
| Here are the Smart Investing & Trading Scores of the most requested China stocks at 12Stocks.com (click stock name for detailed review): |


| 12Stocks.com: Top Performing China Index Stocks | ||||||||||||||||||||||||||||||||||||||||||||||||
 The top performing China Index stocks year to date are
Now, more recently, over last week, the top performing China Index stocks on the move are


|
||||||||||||||||||||||||||||||||||||||||||||||||
| 12Stocks.com: Investing in China Index with Stocks | |
|
The following table helps investors and traders sort through current performance and trends (as measured by Smart Investing & Trading Score) of various
stocks in the China Index. Quick View: Move mouse or cursor over stock symbol (ticker) to view short-term technical chart and over stock name to view long term chart. Click on  to add stock symbol to your watchlist and to add stock symbol to your watchlist and  to view watchlist. Click on any ticker or stock name for detailed market intelligence report for that stock. to view watchlist. Click on any ticker or stock name for detailed market intelligence report for that stock. |
12Stocks.com Performance of Stocks in China Index
| Ticker | Stock Name | Watchlist | Category | Recent Price | Smart Investing & Trading Score | Change % | Weekly Change% |
| TWN | Taiwan Fund |   | Financials | 37.80 | 44 | -1.05% | -3.74% |
| ATHM | Autohome | | Technology | 24.28 | 18 | 0.08% | -3.80% |
| BEKE | KE | | Financials | 12.65 | 10 | -0.78% | -3.88% |
| SOHU | Sohu.com | | Technology | 10.97 | 66 | 0.55% | -4.02% |
| UTSI | UTStarcom | | Technology | 2.59 | 10 | -1.52% | -4.07% |
| CANG | Cango | | Technology | 1.40 | 56 | 1.45% | -4.11% |
| HOLO | MicroCloud Hologram | | Technology | 2.79 | 51 | -3.79% | -4.12% |
| WIMI | WiMi Hologram | | Technology | 0.70 | 51 | -1.62% | -4.32% |
| BZ | Kanzhun | | Industrials | 17.84 | 61 | -1.03% | -4.80% |
| DDL | Dingdong (Cayman) | | Consumer Staples | 1.15 | 30 | 2.68% | -4.96% |
| BILI | Bilibili | | Technology | 10.91 | 36 | -1.45% | -4.97% |
| YQ | 17 Education | | Consumer Staples | 2.46 | 58 | 1.44% | -5.19% |
| FINV | FinVolution | | Financials | 4.74 | 18 | 0.21% | -5.20% |
| DQ | Daqo New | | Technology | 22.11 | 46 | -2.64% | -5.27% |
| XPEV | XPeng | | Services & Goods | 7.04 | 10 | -1.74% | -5.56% |
| ATIF | ATIF | | Financials | 0.98 | 61 | 0.00% | -5.77% |
| QD | Qudian | | Technology | 2.28 | 43 | 1.33% | -5.79% |
| JG | Aurora Mobile | | Technology | 2.92 | 5 | -5.72% | -5.81% |
| YRD | Yiren Digital | | Financials | 4.83 | 61 | -0.41% | -6.21% |
| GDS | GDS | | Technology | 6.32 | 88 | -1.40% | -6.23% |
| JKS | JinkoSolar Holding | | Technology | 21.56 | 10 | -0.46% | -6.34% |
| LXEH | Lixiang Education | | Consumer Staples | 0.41 | 35 | 2.00% | -6.62% |
| VIPS | Vipshop | | Services & Goods | 15.16 | 10 | 0.07% | -6.71% |
| STG | Sunlands | | Services & Goods | 8.16 | 10 | 1.94% | -7.02% |
| YI | 111 | | Services & Goods | 1.02 | 32 | 2.00% | -7.27% |
| For chart view version of above stock list: Chart View ➞ 0 - 25 , 25 - 50 , 50 - 75 , 75 - 100 , 100 - 125 , 125 - 150 | ||
 | Click To Change The Sort Order: By Market Cap or Company Size Performance: Year-to-date, Week and Day |  |
|
Get the most comprehensive stock market coverage daily at 12Stocks.com ➞ Best Stocks Today ➞ Best Stocks Weekly ➞ Best Stocks Year-to-Date ➞ Best Stocks Trends ➞  Best Stocks Today 12Stocks.com Best Nasdaq Stocks ➞ Best S&P 500 Stocks ➞ Best Tech Stocks ➞ Best Biotech Stocks ➞ |
| Detailed Overview of China Stocks |
| China Technical Overview, Leaders & Laggards, Top China ETF Funds & Detailed China Stocks List, Charts, Trends & More |
| China: Technical Analysis, Trends & YTD Performance | |
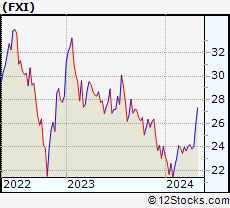
 FXI Weekly Chart |
|
| Long Term Trend: Very Good | |
| Medium Term Trend: Not Good | |
 FXI Daily Chart |
|
| Short Term Trend: Very Good | |
| Overall Trend Score: 74 | |
| YTD Performance: -0.08% | |
| **Trend Scores & Views Are Only For Educational Purposes And Not For Investing | |
| 12Stocks.com: Investing in China Index using Exchange Traded Funds | |
|
The following table shows list of key exchange traded funds (ETF) that
help investors play China stock market. For detailed view, check out our ETF Funds section of our website. Quick View: Move mouse or cursor over ETF symbol (ticker) to view short-term technical chart and over ETF name to view long term chart. Click on ticker or stock name for detailed view. Click on to add stock symbol to your watchlist and to view watchlist. |
12Stocks.com List of ETFs that track China Index
| Ticker | ETF Name | Watchlist | Recent Price | Smart Investing & Trading Score | Change % | Week % | Year-to-date % |
| FXI | China Large-Cap | | 24.01 | 74 | -0.29 | 0.71 | -0.08% |
| EWH | Hong Kong | | 14.70 | 18 | -0.27 | -3.03 | -15.37% |
| YINN | China Bull 3X | | 18.77 | 66 | -0.21 | 2.07 | -10.36% |
| YANG | China Bear 3X | | 11.67 | 32 | 0.78 | -1.85 | -8.83% |
| XPP | China 50 | | 12.97 | 73 | -0.17 | 1.47 | -5.66% |
| MCHI | China | | 39.41 | 61 | -0.33 | 0.33 | -3.26% |
| GXC | China | | 65.33 | 69 | -0.29 | 0.4 | -4.1% |
| CBON | ChinaAMC China Bond | | 21.93 | 60 | 0.05 | 0.3 | -0.79% |
| 12Stocks.com: Charts, Trends, Fundamental Data and Performances of China Stocks | |
|
We now take in-depth look at all China stocks including charts, multi-period performances and overall trends (as measured by Smart Investing & Trading Score). One can sort China stocks (click link to choose) by Daily, Weekly and by Year-to-Date performances. Also, one can sort by size of the company or by market capitalization. |
| Select Your Default Chart Type: | |||||
| |||||
| Click on stock symbol or name for detailed view. Click on to add stock symbol to your watchlist and to view watchlist. Quick View: Move mouse or cursor over "Daily" to quickly view daily technical stock chart and over "Weekly" to view weekly technical stock chart. | |||||

 | TWN The Taiwan Fund, Inc. |
| Sector: Financials | |
| SubSector: Closed-End Fund - Foreign | |
| MarketCap: 110.547 Millions | |
| Recent Price: 37.80 Smart Investing & Trading Score: 44 | |
| Day Percent Change: -1.05% Day Change: -0.40 | |
| Week Change: -3.74% Year-to-date Change: 9.3% | |
| TWN Links: Profile News Message Board | |
| Charts:- Daily , Weekly | |
| Add TWN to Watchlist: View: Get Complete TWN Trend Analysis ➞ | |
 | ATHM Autohome Inc. |
| Sector: Technology | |
| SubSector: Internet Information Providers | |
| MarketCap: 7984.2 Millions | |
| Recent Price: 24.28 Smart Investing & Trading Score: 18 | |
| Day Percent Change: 0.08% Day Change: 0.02 | |
| Week Change: -3.8% Year-to-date Change: -13.5% | |
| ATHM Links: Profile News Message Board | |
| Charts:- Daily , Weekly | |
| Add ATHM to Watchlist: View: Get Complete ATHM Trend Analysis ➞ | |
 | BEKE KE Holdings Inc. |
| Sector: Financials | |
| SubSector: Real Estate Services | |
| MarketCap: 80167 Millions | |
| Recent Price: 12.65 Smart Investing & Trading Score: 10 | |
| Day Percent Change: -0.78% Day Change: -0.10 | |
| Week Change: -3.88% Year-to-date Change: -22.0% | |
| BEKE Links: Profile News Message Board | |
| Charts:- Daily , Weekly | |
| Add BEKE to Watchlist: View: Get Complete BEKE Trend Analysis ➞ | |
 | SOHU Sohu.com Limited |
| Sector: Technology | |
| SubSector: Internet Information Providers | |
| MarketCap: 243.48 Millions | |
| Recent Price: 10.97 Smart Investing & Trading Score: 66 | |
| Day Percent Change: 0.55% Day Change: 0.06 | |
| Week Change: -4.02% Year-to-date Change: 10.5% | |
| SOHU Links: Profile News Message Board | |
| Charts:- Daily , Weekly | |
| Add SOHU to Watchlist: View: Get Complete SOHU Trend Analysis ➞ | |
 | UTSI UTStarcom Holdings Corp. |
| Sector: Technology | |
| SubSector: Communication Equipment | |
| MarketCap: 76.6539 Millions | |
| Recent Price: 2.59 Smart Investing & Trading Score: 10 | |
| Day Percent Change: -1.52% Day Change: -0.04 | |
| Week Change: -4.07% Year-to-date Change: -24.7% | |
| UTSI Links: Profile News Message Board | |
| Charts:- Daily , Weekly | |
| Add UTSI to Watchlist: View: Get Complete UTSI Trend Analysis ➞ | |
 | CANG Cango Inc. |
| Sector: Technology | |
| SubSector: Internet Information Providers | |
| MarketCap: 947.48 Millions | |
| Recent Price: 1.40 Smart Investing & Trading Score: 56 | |
| Day Percent Change: 1.45% Day Change: 0.02 | |
| Week Change: -4.11% Year-to-date Change: 37.3% | |
| CANG Links: Profile News Message Board | |
| Charts:- Daily , Weekly | |
| Add CANG to Watchlist: View: Get Complete CANG Trend Analysis ➞ | |
 | HOLO MicroCloud Hologram Inc. |
| Sector: Technology | |
| SubSector: Electronic Components | |
| MarketCap: 159 Millions | |
| Recent Price: 2.79 Smart Investing & Trading Score: 51 | |
| Day Percent Change: -3.79% Day Change: -0.11 | |
| Week Change: -4.12% Year-to-date Change: 702.9% | |
| HOLO Links: Profile News Message Board | |
| Charts:- Daily , Weekly | |
| Add HOLO to Watchlist: View: Get Complete HOLO Trend Analysis ➞ | |
 | WIMI WiMi Hologram Cloud Inc. |
| Sector: Technology | |
| SubSector: Advertising Agencies | |
| MarketCap: 41837 Millions | |
| Recent Price: 0.70 Smart Investing & Trading Score: 51 | |
| Day Percent Change: -1.62% Day Change: -0.01 | |
| Week Change: -4.32% Year-to-date Change: -13.3% | |
| WIMI Links: Profile News Message Board | |
| Charts:- Daily , Weekly | |
| Add WIMI to Watchlist: View: Get Complete WIMI Trend Analysis ➞ | |
 | BZ Kanzhun Limited |
| Sector: Industrials | |
| SubSector: Staffing & Employment Services | |
| MarketCap: 6680 Millions | |
| Recent Price: 17.84 Smart Investing & Trading Score: 61 | |
| Day Percent Change: -1.03% Day Change: -0.18 | |
| Week Change: -4.8% Year-to-date Change: 8.0% | |
| BZ Links: Profile News Message Board | |
| Charts:- Daily , Weekly | |
| Add BZ to Watchlist: View: Get Complete BZ Trend Analysis ➞ | |
 | DDL Dingdong (Cayman) Limited |
| Sector: Consumer Staples | |
| SubSector: Grocery Stores | |
| MarketCap: 708 Millions | |
| Recent Price: 1.15 Smart Investing & Trading Score: 30 | |
| Day Percent Change: 2.68% Day Change: 0.03 | |
| Week Change: -4.96% Year-to-date Change: -24.3% | |
| DDL Links: Profile News Message Board | |
| Charts:- Daily , Weekly | |
| Add DDL to Watchlist: View: Get Complete DDL Trend Analysis ➞ | |
 | BILI Bilibili Inc. |
| Sector: Technology | |
| SubSector: Internet Information Providers | |
| MarketCap: 7043.1 Millions | |
| Recent Price: 10.91 Smart Investing & Trading Score: 36 | |
| Day Percent Change: -1.45% Day Change: -0.16 | |
| Week Change: -4.97% Year-to-date Change: -10.4% | |
| BILI Links: Profile News Message Board | |
| Charts:- Daily , Weekly | |
| Add BILI to Watchlist: View: Get Complete BILI Trend Analysis ➞ | |
 | YQ 17 Education & Technology Group Inc. |
| Sector: Consumer Staples | |
| SubSector: Education & Training Services | |
| MarketCap: 32347 Millions | |
| Recent Price: 2.46 Smart Investing & Trading Score: 58 | |
| Day Percent Change: 1.44% Day Change: 0.03 | |
| Week Change: -5.19% Year-to-date Change: 20.8% | |
| YQ Links: Profile News Message Board | |
| Charts:- Daily , Weekly | |
| Add YQ to Watchlist: View: Get Complete YQ Trend Analysis ➞ | |
 | FINV FinVolution Group |
| Sector: Financials | |
| SubSector: Credit Services | |
| MarketCap: 476.208 Millions | |
| Recent Price: 4.74 Smart Investing & Trading Score: 18 | |
| Day Percent Change: 0.21% Day Change: 0.01 | |
| Week Change: -5.2% Year-to-date Change: -3.3% | |
| FINV Links: Profile News Message Board | |
| Charts:- Daily , Weekly | |
| Add FINV to Watchlist: View: Get Complete FINV Trend Analysis ➞ | |
 | DQ Daqo New Energy Corp. |
| Sector: Technology | |
| SubSector: Semiconductor Equipment & Materials | |
| MarketCap: 660.918 Millions | |
| Recent Price: 22.11 Smart Investing & Trading Score: 46 | |
| Day Percent Change: -2.64% Day Change: -0.60 | |
| Week Change: -5.27% Year-to-date Change: -16.9% | |
| DQ Links: Profile News Message Board | |
| Charts:- Daily , Weekly | |
| Add DQ to Watchlist: View: Get Complete DQ Trend Analysis ➞ | |
 | XPEV XPeng Inc. |
| Sector: Services & Goods | |
| SubSector: Auto Manufacturers | |
| MarketCap: 32917 Millions | |
| Recent Price: 7.04 Smart Investing & Trading Score: 10 | |
| Day Percent Change: -1.74% Day Change: -0.13 | |
| Week Change: -5.56% Year-to-date Change: -51.7% | |
| XPEV Links: Profile News Message Board | |
| Charts:- Daily , Weekly | |
| Add XPEV to Watchlist: View: Get Complete XPEV Trend Analysis ➞ | |
 | ATIF ATIF Holdings Limited |
| Sector: Financials | |
| SubSector: Asset Management | |
| MarketCap: 68.5203 Millions | |
| Recent Price: 0.98 Smart Investing & Trading Score: 61 | |
| Day Percent Change: 0.00% Day Change: 0.00 | |
| Week Change: -5.77% Year-to-date Change: 1.0% | |
| ATIF Links: Profile News Message Board | |
| Charts:- Daily , Weekly | |
| Add ATIF to Watchlist: View: Get Complete ATIF Trend Analysis ➞ | |
 | QD Qudian Inc. |
| Sector: Technology | |
| SubSector: Information Technology Services | |
| MarketCap: 544.968 Millions | |
| Recent Price: 2.28 Smart Investing & Trading Score: 43 | |
| Day Percent Change: 1.33% Day Change: 0.03 | |
| Week Change: -5.79% Year-to-date Change: 11.8% | |
| QD Links: Profile News Message Board | |
| Charts:- Daily , Weekly | |
| Add QD to Watchlist: View: Get Complete QD Trend Analysis ➞ | |
 | JG Aurora Mobile Limited |
| Sector: Technology | |
| SubSector: Application Software | |
| MarketCap: 268.762 Millions | |
| Recent Price: 2.92 Smart Investing & Trading Score: 5 | |
| Day Percent Change: -5.72% Day Change: -0.18 | |
| Week Change: -5.81% Year-to-date Change: 2.4% | |
| JG Links: Profile News Message Board | |
| Charts:- Daily , Weekly | |
| Add JG to Watchlist: View: Get Complete JG Trend Analysis ➞ | |
 | YRD Yiren Digital Ltd. |
| Sector: Financials | |
| SubSector: Credit Services | |
| MarketCap: 330.208 Millions | |
| Recent Price: 4.83 Smart Investing & Trading Score: 61 | |
| Day Percent Change: -0.41% Day Change: -0.02 | |
| Week Change: -6.21% Year-to-date Change: 54.8% | |
| YRD Links: Profile News Message Board | |
| Charts:- Daily , Weekly | |
| Add YRD to Watchlist: View: Get Complete YRD Trend Analysis ➞ | |
 | GDS GDS Holdings Limited |
| Sector: Technology | |
| SubSector: Data Storage Devices | |
| MarketCap: 8597.99 Millions | |
| Recent Price: 6.32 Smart Investing & Trading Score: 88 | |
| Day Percent Change: -1.40% Day Change: -0.09 | |
| Week Change: -6.23% Year-to-date Change: -30.7% | |
| GDS Links: Profile News Message Board | |
| Charts:- Daily , Weekly | |
| Add GDS to Watchlist: View: Get Complete GDS Trend Analysis ➞ | |
 | JKS JinkoSolar Holding Co., Ltd. |
| Sector: Technology | |
| SubSector: Semiconductor - Specialized | |
| MarketCap: 629.36 Millions | |
| Recent Price: 21.56 Smart Investing & Trading Score: 10 | |
| Day Percent Change: -0.46% Day Change: -0.10 | |
| Week Change: -6.34% Year-to-date Change: -41.6% | |
| JKS Links: Profile News Message Board | |
| Charts:- Daily , Weekly | |
| Add JKS to Watchlist: View: Get Complete JKS Trend Analysis ➞ | |
 | LXEH Lixiang Education Holding Co., Ltd. |
| Sector: Consumer Staples | |
| SubSector: Education & Training Services | |
| MarketCap: 12347 Millions | |
| Recent Price: 0.41 Smart Investing & Trading Score: 35 | |
| Day Percent Change: 2.00% Day Change: 0.01 | |
| Week Change: -6.62% Year-to-date Change: -62.3% | |
| LXEH Links: Profile News Message Board | |
| Charts:- Daily , Weekly | |
| Add LXEH to Watchlist: View: Get Complete LXEH Trend Analysis ➞ | |
 | VIPS Vipshop Holdings Limited |
| Sector: Services & Goods | |
| SubSector: Catalog & Mail Order Houses | |
| MarketCap: 10496.2 Millions | |
| Recent Price: 15.16 Smart Investing & Trading Score: 10 | |
| Day Percent Change: 0.07% Day Change: 0.01 | |
| Week Change: -6.71% Year-to-date Change: -14.6% | |
| VIPS Links: Profile News Message Board | |
| Charts:- Daily , Weekly | |
| Add VIPS to Watchlist: View: Get Complete VIPS Trend Analysis ➞ | |
 | STG Sunlands Technology Group |
| Sector: Services & Goods | |
| SubSector: Education & Training Services | |
| MarketCap: 295.706 Millions | |
| Recent Price: 8.16 Smart Investing & Trading Score: 10 | |
| Day Percent Change: 1.94% Day Change: 0.15 | |
| Week Change: -7.02% Year-to-date Change: -19.7% | |
| STG Links: Profile News Message Board | |
| Charts:- Daily , Weekly | |
| Add STG to Watchlist: View: Get Complete STG Trend Analysis ➞ | |
 | YI 111, Inc. |
| Sector: Services & Goods | |
| SubSector: Drug Stores | |
| MarketCap: 520.351 Millions | |
| Recent Price: 1.02 Smart Investing & Trading Score: 32 | |
| Day Percent Change: 2.00% Day Change: 0.02 | |
| Week Change: -7.27% Year-to-date Change: -34.2% | |
| YI Links: Profile News Message Board | |
| Charts:- Daily , Weekly | |
| Add YI to Watchlist: View: Get Complete YI Trend Analysis ➞ | |
| For tabular summary view of above stock list: Summary View ➞ 0 - 25 , 25 - 50 , 50 - 75 , 75 - 100 , 100 - 125 , 125 - 150 | ||
| Click To Change The Sort Order: By Market Cap or Company Size Performance: Year-to-date, Week and Day | |
| Select Chart Type: | ||
|
Best Stocks Today 12Stocks.com |
© 2024 12Stocks.com Terms & Conditions Privacy Contact Us
All Information Provided Only For Education And Not To Be Used For Investing or Trading. See Terms & Conditions


One More Thing ... Get Best Stocks Delivered Daily!
Never Ever Miss A Move With Our Top Ten Stocks Lists
Find Best Stocks In Any Market - Bull or Bear Market
Take A Peek At Our Top Ten Stocks Lists: Daily, Weekly, Year-to-Date & Top Trends
Find Best Stocks In Any Market - Bull or Bear Market
Take A Peek At Our Top Ten Stocks Lists: Daily, Weekly, Year-to-Date & Top Trends
China Stocks With Best Up Trends [0-bearish to 100-bullish]: Full Truck[93], DouYu [90], GDS [88], Bright Scholar[85], MOGU [83], Lufax Holding[83], So-Young [83], U Power[76], Yatsen Holding[76], MingZhu Logistics[74], Studio City[73]
Best China Stocks Year-to-Date:
U Power[2768.3%], DouYu [747.37%], MicroCloud Hologram[702.88%], China Liberal[476.51%], Zhongchao [412.19%], Yatsen Holding[394.12%], Uxin [141.08%], QuantaSing [106.79%], GigaCloud [89.46%], Bright Scholar[60.8%], Cheetah Mobile[55.26%] Best China Stocks This Week:
Regencell Bioscience[45.67%], Yatsen Holding[20.1%], MingZhu Logistics[17.48%], Secoo Holding[17.14%], Zhongchao [14.02%], TH [11.82%], Bright Scholar[9.24%], Quhuo [8.87%], Smart Share[7.58%], DouYu [6.62%], China Liberal[6.27%] Best China Stocks Daily:
Lanvin [11.19%], MingZhu Logistics[10.31%], Bright Scholar[6.91%], Regencell Bioscience[6.32%], MOGU [5.85%], Cheetah Mobile[5.04%], Secoo Holding[4.75%], Burning Rock[3.52%], Boqii Holding[3.47%], GreenTree Hospitality[3.43%], China Liberal[3.08%]