
 Login Sign Up


| |||||
 |  | ||||

| 12Stocks.com Market Intelligence |
Best Brazil Stocks
|
|
| Quick Read: Top Brazil Stocks By Performances & Trends: Daily, Weekly, Year-to-Date, Market Cap (Size) & Technical Trends | |||
| Best Brazil Views: Quick Browse View, Summary & Slide Show | |||
| 12Stocks.com Brazil Stocks Performances & Trends Daily | |||||||||
|
|  The overall market intelligence score is 17 (0-bearish to 100-bullish) which puts Brazil index in short term bearish trend. The market intelligence score from previous trading session is 49 and hence a deterioration of trend.
| ||||||||
| Here are the market intelligence trend scores of the most requested Brazil stocks at 12Stocks.com (click stock name for detailed review): | |
| Scroll down this page for most comprehensive review of Brazil stocks by performance, trends, technical analysis, charts, fund plays & more | |


| 12Stocks.com: Top Performing Brazil Index Stocks | ||||||||||||||||||||||||||||||||||||||||||||||||
 The top performing Brazil Index stocks year to date are
Now, more recently, over last week, the top performing Brazil Index stocks on the move are


|
||||||||||||||||||||||||||||||||||||||||||||||||
| 12Stocks.com: Investing in Brazil Index with Stocks | |
|
The following table helps investors and traders sort through current performance and trends (as measured by market intelligence score) of various
stocks in the Brazil Index. Quick View: Move mouse or cursor over stock symbol (ticker) to view short-term technical chart and over stock name to view long term chart. Click on  to add stock symbol to your watchlist and to add stock symbol to your watchlist and  to view watchlist. Click on any ticker or stock name for detailed market intelligence report for that stock. to view watchlist. Click on any ticker or stock name for detailed market intelligence report for that stock. |
12Stocks.com Performance of Stocks in Brazil Index
| Ticker | Stock Name | Watchlist | Category | Recent Price | Market Intelligence Score | Change % | YTD Change% |
| AMBI | Ambipar Emergency |   | Industrials | 4.34 | 17 | 5.31 | -44.80% |
| AFYA | Afya | | Services & Goods | 17.20 | 20 | 3.52 | -21.55% |
| NU | Nu | | Financials | 10.87 | 51 | 1.83 | 30.28% |
| VTRU | Vitru | | Consumer Staples | 13.13 | 42 | 0.69 | -17.00% |
| VINP | Vi Partners | | Financials | 10.55 | 32 | 0.67 | -4.00% |
| UGP | par Participacoes | | Energy | 5.05 | 0 | 0.30 | -6.73% |
| INTR | Inter & Co | | Financials | 5.04 | 23 | 0.30 | -10.17% |
| CINT | CI&T | | Technology | 3.96 | 10 | 0.25 | -25.63% |
| EBR | Centrais Eletricas | | Utilities | 7.18 | 10 | 0.21 | -16.65% |
| PBR | Petroleo Brasileiro | | Energy | 16.84 | 62 | 0.21 | 5.48% |
| PAGS | PagSeguro Digital | | Financials | 11.70 | 10 | 0.04 | -6.21% |
| SUZ | Suzano S.A | | Consumer Staples | 11.74 | 36 | 0.04 | 3.39% |
| ERJ | Embraer S.A | | Industrials | 24.47 | 61 | 0.04 | 32.63% |
| BBD | Banco Bradesco | | Financials | 2.66 | 27 | 0.00 | -24.00% |
| BBDO | Banco Bradesco | | Financials | 2.33 | 27 | 0.00 | -26.89% |
| BAK | Braskem S.A | | Materials | 8.79 | 15 | -0.06 | -0.28% |
| SBS | Companhia de | | Utilities | 15.98 | 55 | -0.34 | 4.89% |
| CSAN | Cosan S.A | | Energy | 11.12 | 20 | -0.36 | -29.42% |
| BRFS | BRF S.A | | Consumer Staples | 3.38 | 88 | -0.44 | 21.40% |
| ITUB | Itau Unibanco | | Financials | 6.18 | 35 | -0.48 | -11.08% |
| ELP | Companhia Paranaense | | Utilities | 7.03 | 7 | -0.64 | -17.16% |
| VIV | Telefonica Brasil | | Technology | 9.34 | 35 | -0.85 | -14.63% |
| ABEV | Ambev S.A | | Consumer Staples | 2.30 | 27 | -0.86 | -17.86% |
| CIG | Companhia Energetica | | Utilities | 2.44 | 46 | -1.02 | 4.96% |
| SID | Companhia Siderurgica | | Materials | 2.75 | 27 | -1.26 | -30.15% |
| To view more stocks, click on Next / Previous arrows or select different range: 0 - 25 , 25 - 50 | ||
 | Click To Change The Sort Order: By Market Cap or Company Size Performance: Year-to-date, Week and Day |  |
| Detailed Overview Of Brazil Stocks |
| Brazil Technical Overview, Leaders & Laggards, Top Brazil ETF Funds & Detailed Brazil Stocks List, Charts, Trends & More |
| Brazil: Technical Analysis, Trends & YTD Performance | |
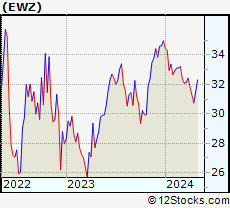
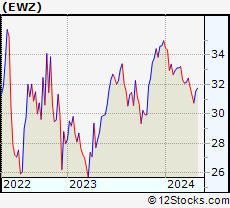
 EWZ Weekly Chart |
|
| Long Term Trend: Not Good | |
| Medium Term Trend: Not Good | |
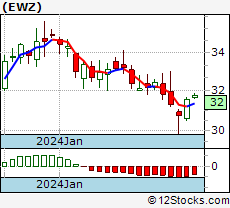
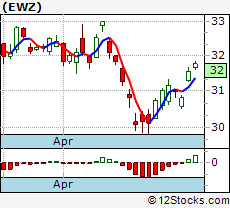 EWZ Daily Chart |
|
| Short Term Trend: Deteriorating | |
| Overall Trend Score: 17 | |
| YTD Performance: -11.99% | |
| **Trend Scores & Views Are Only For Educational Purposes And Not For Investing | |
| 12Stocks.com: Investing in Brazil Index using Exchange Traded Funds | |
|
The following table shows list of key exchange traded funds (ETF) that
help investors play Brazil stock market. For detailed view, check out our ETF Funds section of our website. Quick View: Move mouse or cursor over ETF symbol (ticker) to view short-term technical chart and over ETF name to view long term chart. Click on ticker or stock name for detailed view. Click on to add stock symbol to your watchlist and to view watchlist. |
12Stocks.com List of ETFs that track Brazil Index
| Ticker | ETF Name | Watchlist | Recent Price | Market Intelligence Score | Change % | Week % | Year-to-date % |
| EWZ | Brazil | | 30.77 | 17 | -0.71 | 0.1 | -11.99% |
| UBR | Brazil | | 25.56 | 27 | 0.00 | 1.07 | -24.59% |
| ILF | Latin America 40 | | 27.06 | 10 | -0.92 | -0.04 | -6.88% |
| 12Stocks.com: Charts, Trends, Fundamental Data and Performances of Brazil Stocks | |
|
We now take in-depth look at all Brazil stocks including charts, multi-period performances and overall trends (as measured by market intelligence score). One can sort Brazil stocks (click link to choose) by Daily, Weekly and by Year-to-Date performances. Also, one can sort by size of the company or by market capitalization. |
| Select Your Default Chart Type: | |||||
| |||||
| Click on stock symbol or name for detailed view. Click on to add stock symbol to your watchlist and to view watchlist. Quick View: Move mouse or cursor over "Daily" to quickly view daily technical stock chart and over "Weekly" to view weekly technical stock chart. | |||||
 | AMBI Ambipar Emergency Response |
| Sector: Industrials | |
| SubSector: Waste Management | |
| MarketCap: 462 Millions | |
| Recent Price: 4.34 Market Intelligence Score: 17 | |
| Day Percent Change: 5.31% Day Change: 0.22 | |
| Week Change: -11.09% Year-to-date Change: -44.8% | |
| AMBI Links: Profile News Message Board | |
| Charts:- Daily , Weekly | |
| Add AMBI to Watchlist: View: Get Complete AMBI Trend Analysis ➞ | |
 | AFYA Afya Limited |
| Sector: Services & Goods | |
| SubSector: Education & Training Services | |
| MarketCap: 1559.26 Millions | |
| Recent Price: 17.20 Market Intelligence Score: 20 | |
| Day Percent Change: 3.52% Day Change: 0.58 | |
| Week Change: 7.53% Year-to-date Change: -21.6% | |
| AFYA Links: Profile News Message Board | |
| Charts:- Daily , Weekly | |
| Add AFYA to Watchlist: View: Get Complete AFYA Trend Analysis ➞ | |
 | NU Nu Holdings Ltd. |
| Sector: Financials | |
| SubSector: Banks - Diversified | |
| MarketCap: 37240 Millions | |
| Recent Price: 10.87 Market Intelligence Score: 51 | |
| Day Percent Change: 1.83% Day Change: 0.20 | |
| Week Change: 3.67% Year-to-date Change: 30.3% | |
| NU Links: Profile News Message Board | |
| Charts:- Daily , Weekly | |
| Add NU to Watchlist: View: Get Complete NU Trend Analysis ➞ | |
 | VTRU Vitru Limited |
| Sector: Consumer Staples | |
| SubSector: Education & Training Services | |
| MarketCap: 33347 Millions | |
| Recent Price: 13.13 Market Intelligence Score: 42 | |
| Day Percent Change: 0.69% Day Change: 0.09 | |
| Week Change: 6.49% Year-to-date Change: -17.0% | |
| VTRU Links: Profile News Message Board | |
| Charts:- Daily , Weekly | |
| Add VTRU to Watchlist: View: Get Complete VTRU Trend Analysis ➞ | |
 | VINP Vinci Partners Investments Ltd. |
| Sector: Financials | |
| SubSector: Asset Management | |
| MarketCap: 537 Millions | |
| Recent Price: 10.55 Market Intelligence Score: 32 | |
| Day Percent Change: 0.67% Day Change: 0.07 | |
| Week Change: 2.93% Year-to-date Change: -4.0% | |
| VINP Links: Profile News Message Board | |
| Charts:- Daily , Weekly | |
| Add VINP to Watchlist: View: Get Complete VINP Trend Analysis ➞ | |
 | UGP Ultrapar Participacoes S.A. |
| Sector: Energy | |
| SubSector: Oil & Gas Refining & Marketing | |
| MarketCap: 3473.54 Millions | |
| Recent Price: 5.05 Market Intelligence Score: 0 | |
| Day Percent Change: 0.30% Day Change: 0.01 | |
| Week Change: -1.84% Year-to-date Change: -6.7% | |
| UGP Links: Profile News Message Board | |
| Charts:- Daily , Weekly | |
| Add UGP to Watchlist: View: Get Complete UGP Trend Analysis ➞ | |
 | INTR Inter & Co, Inc. |
| Sector: Financials | |
| SubSector: Banks - Regional | |
| MarketCap: 1250 Millions | |
| Recent Price: 5.04 Market Intelligence Score: 23 | |
| Day Percent Change: 0.30% Day Change: 0.02 | |
| Week Change: -3.36% Year-to-date Change: -10.2% | |
| INTR Links: Profile News Message Board | |
| Charts:- Daily , Weekly | |
| Add INTR to Watchlist: View: Get Complete INTR Trend Analysis ➞ | |
 | CINT CI&T Inc |
| Sector: Technology | |
| SubSector: Software - Infrastructure | |
| MarketCap: 806 Millions | |
| Recent Price: 3.96 Market Intelligence Score: 10 | |
| Day Percent Change: 0.25% Day Change: 0.01 | |
| Week Change: -1.98% Year-to-date Change: -25.6% | |
| CINT Links: Profile News Message Board | |
| Charts:- Daily , Weekly | |
| Add CINT to Watchlist: View: Get Complete CINT Trend Analysis ➞ | |
 | EBR Centrais Eletricas Brasileiras S.A. - Eletrobras |
| Sector: Utilities | |
| SubSector: Electric Utilities | |
| MarketCap: 5459.84 Millions | |
| Recent Price: 7.18 Market Intelligence Score: 10 | |
| Day Percent Change: 0.21% Day Change: 0.01 | |
| Week Change: -2.11% Year-to-date Change: -16.7% | |
| EBR Links: Profile News Message Board | |
| Charts:- Daily , Weekly | |
| Add EBR to Watchlist: View: Get Complete EBR Trend Analysis ➞ | |
 | PBR Petroleo Brasileiro S.A. - Petrobras |
| Sector: Energy | |
| SubSector: Oil & Gas Drilling & Exploration | |
| MarketCap: 38939.2 Millions | |
| Recent Price: 16.84 Market Intelligence Score: 62 | |
| Day Percent Change: 0.21% Day Change: 0.04 | |
| Week Change: 2.28% Year-to-date Change: 5.5% | |
| PBR Links: Profile News Message Board | |
| Charts:- Daily , Weekly | |
| Add PBR to Watchlist: View: Get Complete PBR Trend Analysis ➞ | |
 | PAGS PagSeguro Digital Ltd. |
| Sector: Financials | |
| SubSector: Credit Services | |
| MarketCap: 6500.78 Millions | |
| Recent Price: 11.70 Market Intelligence Score: 10 | |
| Day Percent Change: 0.04% Day Change: 0.01 | |
| Week Change: 1.87% Year-to-date Change: -6.2% | |
| PAGS Links: Profile News Message Board | |
| Charts:- Daily , Weekly | |
| Add PAGS to Watchlist: View: Get Complete PAGS Trend Analysis ➞ | |
 | SUZ Suzano S.A. |
| Sector: Consumer Staples | |
| SubSector: Paper & Paper Products | |
| MarketCap: 7042.93 Millions | |
| Recent Price: 11.74 Market Intelligence Score: 36 | |
| Day Percent Change: 0.04% Day Change: 0.00 | |
| Week Change: -0.38% Year-to-date Change: 3.4% | |
| SUZ Links: Profile News Message Board | |
| Charts:- Daily , Weekly | |
| Add SUZ to Watchlist: View: Get Complete SUZ Trend Analysis ➞ | |
 | ERJ Embraer S.A. |
| Sector: Industrials | |
| SubSector: Aerospace/Defense Products & Services | |
| MarketCap: 1623.71 Millions | |
| Recent Price: 24.47 Market Intelligence Score: 61 | |
| Day Percent Change: 0.04% Day Change: 0.01 | |
| Week Change: 2.86% Year-to-date Change: 32.6% | |
| ERJ Links: Profile News Message Board | |
| Charts:- Daily , Weekly | |
| Add ERJ to Watchlist: View: Get Complete ERJ Trend Analysis ➞ | |
 | BBD Banco Bradesco S.A. |
| Sector: Financials | |
| SubSector: Foreign Regional Banks | |
| MarketCap: 30281.7 Millions | |
| Recent Price: 2.66 Market Intelligence Score: 27 | |
| Day Percent Change: 0.00% Day Change: 0.00 | |
| Week Change: 0.76% Year-to-date Change: -24.0% | |
| BBD Links: Profile News Message Board | |
| Charts:- Daily , Weekly | |
| Add BBD to Watchlist: View: Get Complete BBD Trend Analysis ➞ | |
 | BBDO Banco Bradesco S.A. |
| Sector: Financials | |
| SubSector: Foreign Regional Banks | |
| MarketCap: 27711.4 Millions | |
| Recent Price: 2.33 Market Intelligence Score: 27 | |
| Day Percent Change: 0.00% Day Change: 0.00 | |
| Week Change: -0.21% Year-to-date Change: -26.9% | |
| BBDO Links: Profile News Message Board | |
| Charts:- Daily , Weekly | |
| Add BBDO to Watchlist: View: Get Complete BBDO Trend Analysis ➞ | |
 | BAK Braskem S.A. |
| Sector: Materials | |
| SubSector: Chemicals - Major Diversified | |
| MarketCap: 2715.86 Millions | |
| Recent Price: 8.79 Market Intelligence Score: 15 | |
| Day Percent Change: -0.06% Day Change: -0.01 | |
| Week Change: 1.68% Year-to-date Change: -0.3% | |
| BAK Links: Profile News Message Board | |
| Charts:- Daily , Weekly | |
| Add BAK to Watchlist: View: Get Complete BAK Trend Analysis ➞ | |
 | SBS Companhia de Saneamento Basico do Estado de Sao Paulo - SABESP |
| Sector: Utilities | |
| SubSector: Water Utilities | |
| MarketCap: 5498.72 Millions | |
| Recent Price: 15.98 Market Intelligence Score: 55 | |
| Day Percent Change: -0.34% Day Change: -0.06 | |
| Week Change: 3.13% Year-to-date Change: 4.9% | |
| SBS Links: Profile News Message Board | |
| Charts:- Daily , Weekly | |
| Add SBS to Watchlist: View: Get Complete SBS Trend Analysis ➞ | |
 | CSAN Cosan S.A. |
| Sector: Energy | |
| SubSector: Oil & Gas Refining & Marketing | |
| MarketCap: 6890 Millions | |
| Recent Price: 11.12 Market Intelligence Score: 20 | |
| Day Percent Change: -0.36% Day Change: -0.04 | |
| Week Change: 0.36% Year-to-date Change: -29.4% | |
| CSAN Links: Profile News Message Board | |
| Charts:- Daily , Weekly | |
| Add CSAN to Watchlist: View: Get Complete CSAN Trend Analysis ➞ | |
 | BRFS BRF S.A. |
| Sector: Consumer Staples | |
| SubSector: Meat Products | |
| MarketCap: 2635.51 Millions | |
| Recent Price: 3.38 Market Intelligence Score: 88 | |
| Day Percent Change: -0.44% Day Change: -0.02 | |
| Week Change: 2.9% Year-to-date Change: 21.4% | |
| BRFS Links: Profile News Message Board | |
| Charts:- Daily , Weekly | |
| Add BRFS to Watchlist: View: Get Complete BRFS Trend Analysis ➞ | |
 | ITUB Itau Unibanco Holding S.A. |
| Sector: Financials | |
| SubSector: Foreign Regional Banks | |
| MarketCap: 48121 Millions | |
| Recent Price: 6.18 Market Intelligence Score: 35 | |
| Day Percent Change: -0.48% Day Change: -0.03 | |
| Week Change: 2.15% Year-to-date Change: -11.1% | |
| ITUB Links: Profile News Message Board | |
| Charts:- Daily , Weekly | |
| Add ITUB to Watchlist: View: Get Complete ITUB Trend Analysis ➞ | |
 | ELP Companhia Paranaense de Energia - COPEL |
| Sector: Utilities | |
| SubSector: Electric Utilities | |
| MarketCap: 3352.84 Millions | |
| Recent Price: 7.03 Market Intelligence Score: 7 | |
| Day Percent Change: -0.64% Day Change: -0.04 | |
| Week Change: -3.9% Year-to-date Change: -17.2% | |
| ELP Links: Profile News Message Board | |
| Charts:- Daily , Weekly | |
| Add ELP to Watchlist: View: Get Complete ELP Trend Analysis ➞ | |
 | VIV Telefonica Brasil S.A. |
| Sector: Technology | |
| SubSector: Wireless Communications | |
| MarketCap: 19611.1 Millions | |
| Recent Price: 9.34 Market Intelligence Score: 35 | |
| Day Percent Change: -0.85% Day Change: -0.08 | |
| Week Change: -0.11% Year-to-date Change: -14.6% | |
| VIV Links: Profile News Message Board | |
| Charts:- Daily , Weekly | |
| Add VIV to Watchlist: View: Get Complete VIV Trend Analysis ➞ | |
 | ABEV Ambev S.A. |
| Sector: Consumer Staples | |
| SubSector: Beverages - Brewers | |
| MarketCap: 37753.5 Millions | |
| Recent Price: 2.30 Market Intelligence Score: 27 | |
| Day Percent Change: -0.86% Day Change: -0.02 | |
| Week Change: 0.44% Year-to-date Change: -17.9% | |
| ABEV Links: Profile News Message Board | |
| Charts:- Daily , Weekly | |
| Add ABEV to Watchlist: View: Get Complete ABEV Trend Analysis ➞ | |
 | CIG Companhia Energetica de Minas Gerais |
| Sector: Utilities | |
| SubSector: Electric Utilities | |
| MarketCap: 3203.54 Millions | |
| Recent Price: 2.44 Market Intelligence Score: 46 | |
| Day Percent Change: -1.02% Day Change: -0.02 | |
| Week Change: -1.81% Year-to-date Change: 5.0% | |
| CIG Links: Profile News Message Board | |
| Charts:- Daily , Weekly | |
| Add CIG to Watchlist: View: Get Complete CIG Trend Analysis ➞ | |
 | SID Companhia Siderurgica Nacional |
| Sector: Materials | |
| SubSector: Steel & Iron | |
| MarketCap: 2087.58 Millions | |
| Recent Price: 2.75 Market Intelligence Score: 27 | |
| Day Percent Change: -1.26% Day Change: -0.03 | |
| Week Change: -2.66% Year-to-date Change: -30.2% | |
| SID Links: Profile News Message Board | |
| Charts:- Daily , Weekly | |
| Add SID to Watchlist: View: Get Complete SID Trend Analysis ➞ | |
| To view more stocks, click on Next / Previous arrows or select different range: 0 - 25 , 25 - 50 | ||
| Click To Change The Sort Order: By Market Cap or Company Size Performance: Year-to-date, Week and Day | |
| Select Chart Type: | ||
 Best Stocks Today 12Stocks.com |
© 2024 12Stocks.com Terms & Conditions Privacy Contact Us
All Information Provided Only For Education And Not To Be Used For Investing or Trading. See Terms & Conditions


One More Thing ... Get Best Stocks Delivered Daily!
Never Ever Miss A Move With Our Top Ten Stocks Lists
Find Best Stocks In Any Market - Bull or Bear Market
Take A Peek At Our Top Ten Stocks Lists: Daily, Weekly, Year-to-Date & Top Trends
Find Best Stocks In Any Market - Bull or Bear Market
Take A Peek At Our Top Ten Stocks Lists: Daily, Weekly, Year-to-Date & Top Trends
Brazil Stocks With Best Up Trends [0-bearish to 100-bullish]: BRF S.A[88], Petroleo Brasileiro[62], Embraer S.A[61], Vale S.A[57], Companhia de[55], Nu [51], Companhia Energetica[46], Lavoro [45], Vitru [42], Suzano S.A[36], Itau Unibanco[35]
Best Brazil Stocks Year-to-Date:
Embraer S.A[32.63%], Nu [30.28%], BRF S.A[21.4%], Petroleo Brasileiro[5.48%], Companhia Energetica[4.96%], Companhia de[4.89%], Suzano S.A[3.39%], Braskem S.A[-0.28%], Vi Partners[-4%], PagSeguro Digital[-6.21%], par Participacoes[-6.73%] Best Brazil Stocks This Week:
Afya [7.53%], Vitru [6.49%], Nu [3.67%], Companhia de[3.13%], Vi Partners[2.93%], BRF S.A[2.9%], Embraer S.A[2.86%], Petroleo Brasileiro[2.28%], Itau Unibanco[2.15%], PagSeguro Digital[1.87%], Braskem S.A[1.68%] Best Brazil Stocks Daily:
Ambipar Emergency[5.31%], Afya [3.52%], Nu [1.83%], Vitru [0.69%], Vi Partners[0.67%], par Participacoes[0.30%], Inter & Co[0.30%], CI&T [0.25%], Centrais Eletricas[0.21%], Petroleo Brasileiro[0.21%], PagSeguro Digital[0.04%]