
 Login Sign Up


| |||||
 |  | ||||

| 12Stocks.com Market Intelligence |
Best Biotech Stocks
|
|
| Quick Read: Best Biotech Stocks List By Performances & Trends: Daily, Weekly, Year-to-Date, Market Cap (Size) & Technical Trends | |||
| Best Biotech Stocks Views: Quick Browse View, Summary & Slide Show View | |||
| 12Stocks.com Biotech Stocks Performances & Trends Daily | |||||||||
|
|  The overall market intelligence score is 10 (0-bearish to 100-bullish) which puts Biotech sector in short term bearish trend. The market intelligence score from previous trading session is 0 and hence an improvement of trend.
| ||||||||
Here are the market intelligence trend scores of the most requested Biotech stocks at 12Stocks.com (click stock name for detailed review):
|


| 12Stocks.com: Investing in Biotech sector with Stocks | |
|
The following table helps investors and traders sort through current performance and trends (as measured by market intelligence score) of various
stocks in the Biotech sector. Quick View: Move mouse or cursor over stock symbol (ticker) to view short-term Technical chart and over stock name to view long term chart. Click on  to add stock symbol to your watchlist and to add stock symbol to your watchlist and  to view watchlist. Click on any ticker or stock name for detailed market intelligence report for that stock. to view watchlist. Click on any ticker or stock name for detailed market intelligence report for that stock. |
12Stocks.com Performance of Stocks in Biotech Sector
| Ticker | Stock Name | Watchlist | Category | Recent Price | Market Intelligence Score | Change % | YTD Change% |
| BPMC | Blueprint Medicines |   | Biotechnology | 88.90 | 63 | 0.59% | -3.62% |
| NKTR | Nektar | | Biotechnology | 1.32 | 53 | -2.22% | 133.63% |
| ALLO | Allogene | | Biotechnology | 3.46 | 15 | -1.42% | 7.79% |
| IMCR | Immunocore | | Biotechnology | 53.37 | 10 | -2.20% | -21.39% |
| PTCT | PTC | | Biotechnology | 24.69 | 20 | -1.87% | -10.41% |
| ALEC | Alector | | Biotechnology | 5.09 | 0 | 0.39% | -36.22% |
| CRSP | CRISPR | | Biotechnology | 56.16 | 10 | 1.08% | -10.29% |
| FOLD | Amicus | | Biotechnology | 10.33 | 0 | -2.09% | -27.20% |
| MLTX | MoonLake Immuno | | Biotechnology | 43.39 | 28 | -0.31% | -30.89% |
| MOR | MorphoSys AG | | Biotechnology | 18.05 | 49 | 0.06% | 82.32% |
| AGIO | Agios | | Biotechnology | 29.43 | 75 | 1.38% | 32.15% |
| FGEN | FibroGen | | Biotechnology | 1.17 | 20 | -7.87% | 32.01% |
| PROK | ProKidney | | Biotechnology | 2.31 | 83 | -18.37% | 32.38% |
| EBS | Emergent Bio | | Biotechnology | 1.86 | 36 | -2.11% | -22.50% |
| NUVL | Nuvalent | | Biotechnology | 64.23 | 17 | 0.06% | -12.60% |
| HALO | Halozyme | | Biotechnology | 37.81 | 46 | -0.55% | 2.30% |
| RARE | Ultragenyx | | Biotechnology | 43.38 | 22 | -1.65% | -9.28% |
| DCPH | Deciphera | | Biotechnology | 14.23 | 13 | -3.33% | -11.78% |
| ALKS | Alkermes | | Biotechnology | 23.76 | 10 | -1.04% | -14.35% |
| AXSM | Axsome | | Biotechnology | 65.72 | 0 | -5.72% | -17.43% |
| QURE | uniQure N.V | | Biotechnology | 4.71 | 35 | 2.06% | -30.43% |
| KOD | Kodiak | | Biotechnology | 3.47 | 10 | -3.61% | 14.14% |
| APLS | Apellis | | Biotechnology | 47.51 | 0 | -1.08% | -20.63% |
| SLRN | Acelyrin | | Biotechnology | 4.96 | 20 | -1.29% | -32.77% |
| BHVN | Biohaven | | Biotechnology | 42.16 | 0 | -4.25% | -1.50% |
| To view more stocks, click on Next / Previous arrows or select different range: 0 - 25 , 25 - 50 , 50 - 75 , 75 - 100 , 100 - 125 , 125 - 150 , 150 - 175 , 175 - 200 , 200 - 225 , 225 - 250 , 250 - 275 , 275 - 300 , 300 - 325 , 325 - 350 , 350 - 375 , 375 - 400 | ||
 | Click To Change The Sort Order: By Market Cap or Company Size Performance: Year-to-date, Week and Day |  |
|
Get the most comprehensive stock market coverage daily at 12Stocks.com ➞ Best Stocks Today ➞ Best Stocks Weekly ➞ Best Stocks Year-to-Date ➞ Best Stocks Trends ➞  Best Stocks Today 12Stocks.com Best Nasdaq Stocks ➞ Best S&P 500 Stocks ➞ Best Tech Stocks ➞ Best Biotech Stocks ➞ |
| Detailed Overview of Biotech Stocks |
| Biotech Technical Overview, Leaders & Laggards, Top Biotech ETF Funds & Detailed Biotech Stocks List, Charts, Trends & More |
| Biotech Sector: Technical Analysis, Trends & YTD Performance | |
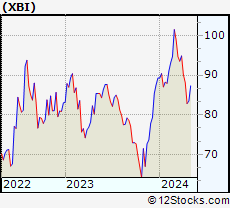
| Biotech sector, as represented by XBI, an exchange-traded fund [ETF] that holds basket of Biotech stocks (e.g, Amgen, Celgene) is down by -6.51% and is currently underperforming the overall market by -10.7% year-to-date. Below is a quick view of Technical charts and trends: | |
 XBI Weekly Chart |
|
| Long Term Trend: Not Good | |
| Medium Term Trend: Not Good | |
 XBI Daily Chart |
|
| Short Term Trend: Deteriorating | |
| Overall Trend Score: 10 | |
| YTD Performance: -6.51% | |
| **Trend Scores & Views Are Only For Educational Purposes And Not For Investing | |
| 12Stocks.com: Top Performing Biotech Sector Stocks | ||||||||||||||||||||||||||||||||||||||||||||||||
 The top performing Biotech sector stocks year to date are
Now, more recently, over last week, the top performing Biotech sector stocks on the move are


|
||||||||||||||||||||||||||||||||||||||||||||||||
| 12Stocks.com: Investing in Biotech Sector using Exchange Traded Funds | |
|
The following table shows list of key exchange traded funds (ETF) that
help investors track Biotech Index. For detailed view, check out our ETF Funds section of our website. Quick View: Move mouse or cursor over ETF symbol (ticker) to view short-term Technical chart and over ETF name to view long term chart. Click on ticker or stock name for detailed view. Click on to add stock symbol to your watchlist and to view watchlist. |
12Stocks.com List of ETFs that track Biotech Index
| Ticker | ETF Name | Watchlist | Recent Price | Market Intelligence Score | Change % | Week % | Year-to-date % |
| LABD | Biotech Bear 3X | | 10.52 | 82 | 4.37 | 17.15 | 8.57% |
| XBI | Biotech | | 83.48 | 10 | -1.38 | -5.3 | -6.51% |
| LABU | Biotech Bull 3X | | 88.04 | 10 | -4.33 | -15.63 | -27.82% |
| IBB | Biotechnology | | 124.64 | 0 | -0.99 | -3.81 | -8.25% |
| IYH | Healthcare | | 58.05 | 10 | -0.02 | -0.6 | 1.4% |
| IXJ | Global Healthcare | | 87.41 | 18 | -0.26 | -0.65 | 0.8% |
| BTEC | Principal Healthcare Innovators | | 34.09 | 0 | -1.51 | -5.29 | -6.17% |
| IHF | Healthcare Providers | | 51.55 | 32 | 0.93 | 1.99 | -1.84% |
| CURE | Healthcare Bull 3X | | 102.22 | 18 | -0.44 | -1.14 | 0.47% |
| FBT | First NYSE | | 141.52 | 10 | -1.52 | -3.94 | -10.46% |
| BIB | Biotechnology | | 47.94 | 0 | -2.02 | -6.71 | -15.97% |
| BIS | Short Biotech | | 20.87 | 100 | 1.69 | 6.46 | 15.47% |
| PTH | DWA Healthcare Momentum | | 39.57 | 46 | -2.18 | -5.4 | 1.1% |
| PBE | Biotech & Genome | | 59.62 | 18 | -1.75 | -2.66 | -9.45% |
| BBH | Biotech | | 152.35 | 10 | -0.43 | -3.33 | -7.84% |
| BBP | Bio Biotechnology Products | | 50.60 | 0 | -2.76 | -4.7 | -12.9% |
| BBC | Bio Biotechnology Clinical | | 25.48 | 36 | -1.32 | -6.06 | 4.2% |
| 12Stocks.com: Charts, Trends, Fundamental Data and Performances of Biotech Stocks | |
|
We now take in-depth look at all Biotech stocks including charts, multi-period performances and overall trends (as measured by market intelligence score). One can sort Biotech stocks (click link to choose) by Daily, Weekly and by Year-to-Date performances. Also, one can sort by size of the company or by market capitalization. |
| Select Your Default Chart Type: | |||||
| |||||
| Click on stock symbol or name for detailed view. Click on to add stock symbol to your watchlist and to view watchlist. Quick View: Move mouse or cursor over "Daily" to quickly view daily Technical stock chart and over "Weekly" to view weekly Technical stock chart. | |||||

 | BPMC Blueprint Medicines Corporation |
| Sector: Health Care | |
| SubSector: Biotechnology | |
| MarketCap: 3113.55 Millions | |
| Recent Price: 88.90 Market Intelligence Score: 63 | |
| Day Percent Change: 0.59% Day Change: 0.52 | |
| Week Change: 1.89% Year-to-date Change: -3.6% | |
| BPMC Links: Profile News Message Board | |
| Charts:- Daily , Weekly | |
| Add BPMC to Watchlist: View: Get Complete BPMC Trend Analysis ➞ | |
 | NKTR Nektar Therapeutics |
| Sector: Health Care | |
| SubSector: Biotechnology | |
| MarketCap: 2953.45 Millions | |
| Recent Price: 1.32 Market Intelligence Score: 53 | |
| Day Percent Change: -2.22% Day Change: -0.03 | |
| Week Change: -20.96% Year-to-date Change: 133.6% | |
| NKTR Links: Profile News Message Board | |
| Charts:- Daily , Weekly | |
| Add NKTR to Watchlist: View: Get Complete NKTR Trend Analysis ➞ | |
 | ALLO Allogene Therapeutics, Inc. |
| Sector: Health Care | |
| SubSector: Biotechnology | |
| MarketCap: 2858.65 Millions | |
| Recent Price: 3.46 Market Intelligence Score: 15 | |
| Day Percent Change: -1.42% Day Change: -0.05 | |
| Week Change: -8.95% Year-to-date Change: 7.8% | |
| ALLO Links: Profile News Message Board | |
| Charts:- Daily , Weekly | |
| Add ALLO to Watchlist: View: Get Complete ALLO Trend Analysis ➞ | |
 | IMCR Immunocore Holdings plc |
| Sector: Health Care | |
| SubSector: Biotechnology | |
| MarketCap: 2830 Millions | |
| Recent Price: 53.37 Market Intelligence Score: 10 | |
| Day Percent Change: -2.20% Day Change: -1.20 | |
| Week Change: -5.59% Year-to-date Change: -21.4% | |
| IMCR Links: Profile News Message Board | |
| Charts:- Daily , Weekly | |
| Add IMCR to Watchlist: View: Get Complete IMCR Trend Analysis ➞ | |
 | PTCT PTC Therapeutics, Inc. |
| Sector: Health Care | |
| SubSector: Biotechnology | |
| MarketCap: 2795.85 Millions | |
| Recent Price: 24.69 Market Intelligence Score: 20 | |
| Day Percent Change: -1.87% Day Change: -0.47 | |
| Week Change: -6.55% Year-to-date Change: -10.4% | |
| PTCT Links: Profile News Message Board | |
| Charts:- Daily , Weekly | |
| Add PTCT to Watchlist: View: Get Complete PTCT Trend Analysis ➞ | |
 | ALEC Alector, Inc. |
| Sector: Health Care | |
| SubSector: Biotechnology | |
| MarketCap: 2719.35 Millions | |
| Recent Price: 5.09 Market Intelligence Score: 0 | |
| Day Percent Change: 0.39% Day Change: 0.02 | |
| Week Change: -15.45% Year-to-date Change: -36.2% | |
| ALEC Links: Profile News Message Board | |
| Charts:- Daily , Weekly | |
| Add ALEC to Watchlist: View: Get Complete ALEC Trend Analysis ➞ | |
 | CRSP CRISPR Therapeutics AG |
| Sector: Health Care | |
| SubSector: Biotechnology | |
| MarketCap: 2691.35 Millions | |
| Recent Price: 56.16 Market Intelligence Score: 10 | |
| Day Percent Change: 1.08% Day Change: 0.60 | |
| Week Change: -7.43% Year-to-date Change: -10.3% | |
| CRSP Links: Profile News Message Board | |
| Charts:- Daily , Weekly | |
| Add CRSP to Watchlist: View: Get Complete CRSP Trend Analysis ➞ | |
 | FOLD Amicus Therapeutics, Inc. |
| Sector: Health Care | |
| SubSector: Biotechnology | |
| MarketCap: 2676.75 Millions | |
| Recent Price: 10.33 Market Intelligence Score: 0 | |
| Day Percent Change: -2.09% Day Change: -0.22 | |
| Week Change: -7.93% Year-to-date Change: -27.2% | |
| FOLD Links: Profile News Message Board | |
| Charts:- Daily , Weekly | |
| Add FOLD to Watchlist: View: Get Complete FOLD Trend Analysis ➞ | |
 | MLTX MoonLake Immunotherapeutics |
| Sector: Health Care | |
| SubSector: Biotechnology | |
| MarketCap: 2670 Millions | |
| Recent Price: 43.39 Market Intelligence Score: 28 | |
| Day Percent Change: -0.31% Day Change: -0.13 | |
| Week Change: -1.18% Year-to-date Change: -30.9% | |
| MLTX Links: Profile News Message Board | |
| Charts:- Daily , Weekly | |
| Add MLTX to Watchlist: View: Get Complete MLTX Trend Analysis ➞ | |
 | MOR MorphoSys AG |
| Sector: Health Care | |
| SubSector: Biotechnology | |
| MarketCap: 2636.85 Millions | |
| Recent Price: 18.05 Market Intelligence Score: 49 | |
| Day Percent Change: 0.06% Day Change: 0.01 | |
| Week Change: -0.06% Year-to-date Change: 82.3% | |
| MOR Links: Profile News Message Board | |
| Charts:- Daily , Weekly | |
| Add MOR to Watchlist: View: Get Complete MOR Trend Analysis ➞ | |
 | AGIO Agios Pharmaceuticals, Inc. |
| Sector: Health Care | |
| SubSector: Biotechnology | |
| MarketCap: 2613.35 Millions | |
| Recent Price: 29.43 Market Intelligence Score: 75 | |
| Day Percent Change: 1.38% Day Change: 0.40 | |
| Week Change: -0.27% Year-to-date Change: 32.2% | |
| AGIO Links: Profile News Message Board | |
| Charts:- Daily , Weekly | |
| Add AGIO to Watchlist: View: Get Complete AGIO Trend Analysis ➞ | |
 | FGEN FibroGen, Inc. |
| Sector: Health Care | |
| SubSector: Biotechnology | |
| MarketCap: 2502.95 Millions | |
| Recent Price: 1.17 Market Intelligence Score: 20 | |
| Day Percent Change: -7.87% Day Change: -0.10 | |
| Week Change: -13.97% Year-to-date Change: 32.0% | |
| FGEN Links: Profile News Message Board | |
| Charts:- Daily , Weekly | |
| Add FGEN to Watchlist: View: Get Complete FGEN Trend Analysis ➞ | |
 | PROK ProKidney Corp. |
| Sector: Health Care | |
| SubSector: Biotechnology | |
| MarketCap: 2470 Millions | |
| Recent Price: 2.31 Market Intelligence Score: 83 | |
| Day Percent Change: -18.37% Day Change: -0.52 | |
| Week Change: 32% Year-to-date Change: 32.4% | |
| PROK Links: Profile News Message Board | |
| Charts:- Daily , Weekly | |
| Add PROK to Watchlist: View: Get Complete PROK Trend Analysis ➞ | |
 | EBS Emergent BioSolutions Inc. |
| Sector: Health Care | |
| SubSector: Biotechnology | |
| MarketCap: 2417.65 Millions | |
| Recent Price: 1.86 Market Intelligence Score: 36 | |
| Day Percent Change: -2.11% Day Change: -0.04 | |
| Week Change: -9.71% Year-to-date Change: -22.5% | |
| EBS Links: Profile News Message Board | |
| Charts:- Daily , Weekly | |
| Add EBS to Watchlist: View: Get Complete EBS Trend Analysis ➞ | |
 | NUVL Nuvalent, Inc. |
| Sector: Health Care | |
| SubSector: Biotechnology | |
| MarketCap: 2400 Millions | |
| Recent Price: 64.23 Market Intelligence Score: 17 | |
| Day Percent Change: 0.06% Day Change: 0.04 | |
| Week Change: -1.95% Year-to-date Change: -12.6% | |
| NUVL Links: Profile News Message Board | |
| Charts:- Daily , Weekly | |
| Add NUVL to Watchlist: View: Get Complete NUVL Trend Analysis ➞ | |
 | HALO Halozyme Therapeutics, Inc. |
| Sector: Health Care | |
| SubSector: Biotechnology | |
| MarketCap: 2383.75 Millions | |
| Recent Price: 37.81 Market Intelligence Score: 46 | |
| Day Percent Change: -0.55% Day Change: -0.21 | |
| Week Change: -2.07% Year-to-date Change: 2.3% | |
| HALO Links: Profile News Message Board | |
| Charts:- Daily , Weekly | |
| Add HALO to Watchlist: View: Get Complete HALO Trend Analysis ➞ | |
 | RARE Ultragenyx Pharmaceutical Inc. |
| Sector: Health Care | |
| SubSector: Biotechnology | |
| MarketCap: 2373.35 Millions | |
| Recent Price: 43.38 Market Intelligence Score: 22 | |
| Day Percent Change: -1.65% Day Change: -0.73 | |
| Week Change: -7.7% Year-to-date Change: -9.3% | |
| RARE Links: Profile News Message Board | |
| Charts:- Daily , Weekly | |
| Add RARE to Watchlist: View: Get Complete RARE Trend Analysis ➞ | |
 | DCPH Deciphera Pharmaceuticals, Inc. |
| Sector: Health Care | |
| SubSector: Biotechnology | |
| MarketCap: 2329.95 Millions | |
| Recent Price: 14.23 Market Intelligence Score: 13 | |
| Day Percent Change: -3.33% Day Change: -0.49 | |
| Week Change: -5.45% Year-to-date Change: -11.8% | |
| DCPH Links: Profile News Message Board | |
| Charts:- Daily , Weekly | |
| Add DCPH to Watchlist: View: Get Complete DCPH Trend Analysis ➞ | |
 | ALKS Alkermes plc |
| Sector: Health Care | |
| SubSector: Biotechnology | |
| MarketCap: 2311.95 Millions | |
| Recent Price: 23.76 Market Intelligence Score: 10 | |
| Day Percent Change: -1.04% Day Change: -0.25 | |
| Week Change: -2.7% Year-to-date Change: -14.4% | |
| ALKS Links: Profile News Message Board | |
| Charts:- Daily , Weekly | |
| Add ALKS to Watchlist: View: Get Complete ALKS Trend Analysis ➞ | |
 | AXSM Axsome Therapeutics, Inc. |
| Sector: Health Care | |
| SubSector: Biotechnology | |
| MarketCap: 2284.25 Millions | |
| Recent Price: 65.72 Market Intelligence Score: 0 | |
| Day Percent Change: -5.72% Day Change: -3.99 | |
| Week Change: -4.96% Year-to-date Change: -17.4% | |
| AXSM Links: Profile News Message Board | |
| Charts:- Daily , Weekly | |
| Add AXSM to Watchlist: View: Get Complete AXSM Trend Analysis ➞ | |
 | QURE uniQure N.V. |
| Sector: Health Care | |
| SubSector: Biotechnology | |
| MarketCap: 2267.25 Millions | |
| Recent Price: 4.71 Market Intelligence Score: 35 | |
| Day Percent Change: 2.06% Day Change: 0.09 | |
| Week Change: -1.67% Year-to-date Change: -30.4% | |
| QURE Links: Profile News Message Board | |
| Charts:- Daily , Weekly | |
| Add QURE to Watchlist: View: Get Complete QURE Trend Analysis ➞ | |
 | KOD Kodiak Sciences Inc. |
| Sector: Health Care | |
| SubSector: Biotechnology | |
| MarketCap: 2132.15 Millions | |
| Recent Price: 3.47 Market Intelligence Score: 10 | |
| Day Percent Change: -3.61% Day Change: -0.13 | |
| Week Change: -21.32% Year-to-date Change: 14.1% | |
| KOD Links: Profile News Message Board | |
| Charts:- Daily , Weekly | |
| Add KOD to Watchlist: View: Get Complete KOD Trend Analysis ➞ | |
 | APLS Apellis Pharmaceuticals, Inc. |
| Sector: Health Care | |
| SubSector: Biotechnology | |
| MarketCap: 2030.95 Millions | |
| Recent Price: 47.51 Market Intelligence Score: 0 | |
| Day Percent Change: -1.08% Day Change: -0.52 | |
| Week Change: -8.26% Year-to-date Change: -20.6% | |
| APLS Links: Profile News Message Board | |
| Charts:- Daily , Weekly | |
| Add APLS to Watchlist: View: Get Complete APLS Trend Analysis ➞ | |
 | SLRN Acelyrin, Inc. |
| Sector: Health Care | |
| SubSector: Biotechnology | |
| MarketCap: 2030 Millions | |
| Recent Price: 4.96 Market Intelligence Score: 20 | |
| Day Percent Change: -1.29% Day Change: -0.06 | |
| Week Change: -7.73% Year-to-date Change: -32.8% | |
| SLRN Links: Profile News Message Board | |
| Charts:- Daily , Weekly | |
| Add SLRN to Watchlist: View: Get Complete SLRN Trend Analysis ➞ | |
 | BHVN Biohaven Pharmaceutical Holding Company Ltd. |
| Sector: Health Care | |
| SubSector: Biotechnology | |
| MarketCap: 2024.25 Millions | |
| Recent Price: 42.16 Market Intelligence Score: 0 | |
| Day Percent Change: -4.25% Day Change: -1.87 | |
| Week Change: -20.57% Year-to-date Change: -1.5% | |
| BHVN Links: Profile News Message Board | |
| Charts:- Daily , Weekly | |
| Add BHVN to Watchlist: View: Get Complete BHVN Trend Analysis ➞ | |
| To view more stocks, click on Next / Previous arrows or select different range: 0 - 25 , 25 - 50 , 50 - 75 , 75 - 100 , 100 - 125 , 125 - 150 , 150 - 175 , 175 - 200 , 200 - 225 , 225 - 250 , 250 - 275 , 275 - 300 , 300 - 325 , 325 - 350 , 350 - 375 , 375 - 400 | ||
| Click To Change The Sort Order: By Market Cap or Company Size Performance: Year-to-date, Week and Day | |
| Select Chart Type: | ||
|
Best Stocks Today 12Stocks.com |
© 2024 12Stocks.com Terms & Conditions Privacy Contact Us
All Information Provided Only For Education And Not To Be Used For Investing or Trading. See Terms & Conditions


One More Thing ... Get Best Stocks Delivered Daily!
Never Ever Miss A Move With Our Top Ten Stocks Lists
Find Best Stocks In Any Market - Bull or Bear Market
Take A Peek At Our Top Ten Stocks Lists: Daily, Weekly, Year-to-Date & Top Trends
Find Best Stocks In Any Market - Bull or Bear Market
Take A Peek At Our Top Ten Stocks Lists: Daily, Weekly, Year-to-Date & Top Trends
Biotech Stocks With Best Up Trends [0-bearish to 100-bullish]: Cullinan Oncology[100], ALX Oncology[100], Zura Bio[93], NuCana [93], Reneo [93], Vanda [93], Acrivon [88], Shattuck Labs[88], United [88], Geron [85], Avadel [83]
Best Biotech Stocks Year-to-Date:
Precision [2836.99%], Inovio [1900%], Assembly [1525.41%], Adverum nologies[1381.14%], NuCana [1269.17%], Affimed N.V[711.2%], Corbus [504.8%], Agenus [500.31%], Mesoblast [364.55%], Janux [348.12%], Addex [294.25%] Best Biotech Stocks This Week:
NuCana [1708.84%], ProKidney [32%], ALX Oncology[20.64%], Vanda [20.63%], Galera [16.43%], Cullinan Oncology[13.89%], Rani [13.15%], Humacyte [12.67%], Bicycle [9.91%], Zura Bio[9.52%], Intra-Cellular Therapies[9.29%] Best Biotech Stocks Daily:
Zura Bio[17.20%], Bicycle [12.33%], Vaxxinity [10.05%], Annovis Bio[9.57%], RedHill Biopharma[9.16%], Cullinan Oncology[6.42%], Longboard [6.07%], Addex [5.31%], Ginkgo Bioworks[5.13%], Century [5.13%], Acrivon [5.08%]