
 Login Sign Up


| |||||
 |  | ||||

| 12Stocks.com Market Intelligence |
Best Asia Stocks
|
|
| Quick Read: Top Asia Stocks By Performances & Trends: Daily, Weekly, Year-to-Date, Market Cap (Size) & Technical Trends | |||
| Best Asia Views: Quick Browse View, Summary & Slide Show | |||
| 12Stocks.com Asia Stocks Performances & Trends Daily | |||||||||
|
|  The overall market intelligence score is 23 (0-bearish to 100-bullish) which puts Asia index in short term bearish to neutral trend. The market intelligence score from previous trading session is 30 and hence a deterioration of trend.
| ||||||||
Here are the market intelligence trend scores of the most requested Asia stocks at 12Stocks.com (click stock name for detailed review):
|


| Consider signing up for our daily 12Stocks.com "Best Stocks Newsletter". You will never ever miss a big stock move again! |
| 12Stocks.com: Top Performing Asia Index Stocks | ||||||||||||||||||||||||||||||||||||||||||||||||
 The top performing Asia Index stocks year to date are
Now, more recently, over last week, the top performing Asia Index stocks on the move are


|
||||||||||||||||||||||||||||||||||||||||||||||||
| 12Stocks.com: Investing in Asia Index with Stocks | |
|
The following table helps investors and traders sort through current performance and trends (as measured by market intelligence score) of various
stocks in the Asia Index. Quick View: Move mouse or cursor over stock symbol (ticker) to view short-term technical chart and over stock name to view long term chart. Click on  to add stock symbol to your watchlist and to add stock symbol to your watchlist and  to view watchlist. Click on any ticker or stock name for detailed market intelligence report for that stock. to view watchlist. Click on any ticker or stock name for detailed market intelligence report for that stock. |
12Stocks.com Performance of Stocks in Asia Index
| Ticker | Stock Name | Watchlist | Category | Recent Price | Market Intelligence Score | Change % | YTD Change% |
| BQ | Boqii Holding |   | Services & Goods | 0.27 | 54 | 3.47% | -40.02% |
| XPEV | XPeng | | Services & Goods | 7.04 | 10 | -1.74% | -51.71% |
| YQ | 17 Education | | Consumer Staples | 2.46 | 58 | 1.44% | 20.83% |
| EDTK | Skillful Craftsman | | Consumer Staples | 0.92 | 18 | -0.54% | -27.38% |
| CLEU | China Liberal | | Consumer Staples | 1.03 | 49 | 3.08% | 476.51% |
| IBN | ICICI Bank | | Financials | 25.68 | 61 | 0.98% | 7.72% |
| TAL | TAL Education | | Services & Goods | 11.43 | 73 | -1.89% | -9.50% |
| HDB | HDFC Bank | | Financials | 59.05 | 93 | 2.91% | -12.01% |
| LI | Li Auto | | Services & Goods | 27.21 | 0 | -6.78% | -27.32% |
| CHT | Chunghwa Telecom | | Technology | 37.85 | 13 | -0.81% | -3.12% |
| MFG | Mizuho Financial | | Financials | 3.85 | 43 | 0.26% | 11.92% |
| BNR | Burning Rock | | Health Care | 0.80 | 54 | 3.52% | -17.09% |
| IMAB | I Mab | | Health Care | 1.81 | 63 | 0.56% | -4.74% |
| ZTO | ZTO Express | | Transports | 19.94 | 68 | -0.30% | -6.30% |
| EDU | New Oriental | | Services & Goods | 84.99 | 41 | -2.19% | 15.98% |
| YUMC | Yum China | | Services & Goods | 37.10 | 61 | -0.32% | -12.56% |
| TME | Tencent Music | | Technology | 11.36 | 61 | -1.90% | 26.08% |
| IX | ORIX | | Financials | 101.44 | 36 | -0.30% | 8.62% |
| NMR | Nomura | | Financials | 5.77 | 23 | -1.70% | 27.94% |
| WIT | Wipro | | Technology | 5.25 | 17 | 1.74% | -5.75% |
| IQ | iQIYI | | Technology | 4.09 | 39 | -2.74% | -16.29% |
| TCOM | Trip.com | | Services & Goods | 48.00 | 51 | -1.48% | 33.30% |
| LXEH | Lixiang Education | | Consumer Staples | 0.41 | 35 | 2.00% | -62.30% |
| IH | iHuman | | Consumer Staples | 1.73 | 25 | 0.99% | -43.21% |
| YSG | Yatsen Holding | | Services & Goods | 3.62 | 76 | 0.98% | 394.12% |
| To view more stocks, click on Next / Previous arrows or select different range: 0 - 25 , 25 - 50 , 50 - 75 , 75 - 100 , 100 - 125 , 125 - 150 , 150 - 175 , 175 - 200 , 200 - 225 | ||
 | Click To Change The Sort Order: By Market Cap or Company Size Performance: Year-to-date, Week and Day |  |
|
Get the most comprehensive stock market coverage daily at 12Stocks.com ➞ Best Stocks Today ➞ Best Stocks Weekly ➞ Best Stocks Year-to-Date ➞ Best Stocks Trends ➞  Best Stocks Today 12Stocks.com Best Nasdaq Stocks ➞ Best S&P 500 Stocks ➞ Best Tech Stocks ➞ Best Biotech Stocks ➞ |
| Detailed Overview of Asia Stocks |
| Asia Technical Overview, Leaders & Laggards, Top Asia ETF Funds & Detailed Asia Stocks List, Charts, Trends & More |
| Asia: Technical Analysis, Trends & YTD Performance | |
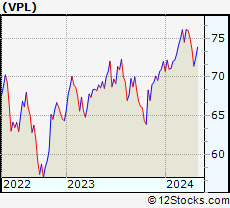
 VPL Weekly Chart |
|
| Long Term Trend: Good | |
| Medium Term Trend: Not Good | |
 VPL Daily Chart |
|
| Short Term Trend: Not Good | |
| Overall Trend Score: 23 | |
| YTD Performance: -0.83% | |
| **Trend Scores & Views Are Only For Educational Purposes And Not For Investing | |
| 12Stocks.com: Investing in Asia Index using Exchange Traded Funds | |
|
The following table shows list of key exchange traded funds (ETF) that
help investors play Asia stock market. For detailed view, check out our ETF Funds section of our website. Quick View: Move mouse or cursor over ETF symbol (ticker) to view short-term technical chart and over ETF name to view long term chart. Click on ticker or stock name for detailed view. Click on to add stock symbol to your watchlist and to view watchlist. |
12Stocks.com List of ETFs that track Asia Index
| Ticker | ETF Name | Watchlist | Recent Price | Market Intelligence Score | Change % | Week % | Year-to-date % |
| VPL | Pacific | | 71.43 | 23 | -0.43 | -2.97 | -0.83% |
| EEMA | Emerging Markets Asia | | 66.09 | 49 | -0.40 | -1.85 | -0.03% |
| AIA | Asia 50 | | 58.11 | 31 | -1.36 | -3.38 | 0.24% |
| AAXJ | All Country Asia | | 65.49 | 44 | -0.70 | -1.95 | -1.62% |
| GMF | Emerging Asia Pacific | | 101.10 | 39 | -0.57 | -2.22 | 0.03% |
| EPP | Pacific ex Japan | | 40.80 | 18 | 0.12 | -2.02 | -6.01% |
| ASEA | Southeast Asia | | 14.49 | 31 | -0.69 | -1.38 | -3.92% |
| DVYA | Asia/Pacific Dividend | | 35.36 | 31 | -0.04 | -1.18 | -1.11% |
| IPAC | Core Pacific | | 59.59 | 10 | -0.42 | -3.09 | 0.13% |
| FXI | China Large-Cap | | 24.01 | 74 | -0.29 | 0.71 | -0.08% |
| EWY | South Korea | | 61.32 | 44 | -0.78 | -2.06 | -6.42% |
| EWT | Taiwan | | 45.71 | 26 | -2.10 | -5.5 | -0.7% |
| EWJ | Japan | | 66.49 | 23 | -0.60 | -3.72 | 3.66% |
| EWH | Hong Kong | | 14.70 | 18 | -0.27 | -3.03 | -15.37% |
| EWS | Singapore | | 18.21 | 68 | 0.55 | 0.5 | -2.62% |
| EWM | Malaysia | | 21.76 | 76 | 0.55 | 0.55 | 2.4% |
| EPHE | Philippines | | 24.74 | 18 | -1.32 | -4.88 | -4.81% |
| EIDO | Indonesia | | 20.78 | 18 | -0.53 | -3.17 | -6.9% |
| THD | Thailand | | 56.60 | 0 | -1.63 | -4.02 | -11.37% |
| VNM | Vietnam | | 11.85 | 0 | -2.31 | -10.63 | -8.28% |
| 12Stocks.com: Charts, Trends, Fundamental Data and Performances of Asia Stocks | |
|
We now take in-depth look at all Asia stocks including charts, multi-period performances and overall trends (as measured by market intelligence score). One can sort Asia stocks (click link to choose) by Daily, Weekly and by Year-to-Date performances. Also, one can sort by size of the company or by market capitalization. |
| Select Your Default Chart Type: | |||||
| |||||
| Click on stock symbol or name for detailed view. Click on to add stock symbol to your watchlist and to view watchlist. Quick View: Move mouse or cursor over "Daily" to quickly view daily technical stock chart and over "Weekly" to view weekly technical stock chart. | |||||

 | BQ Boqii Holding Limited |
| Sector: Services & Goods | |
| SubSector: Specialty Retail | |
| MarketCap: 33027 Millions | |
| Recent Price: 0.27 Market Intelligence Score: 54 | |
| Day Percent Change: 3.47% Day Change: 0.01 | |
| Week Change: 5.07% Year-to-date Change: -40.0% | |
| BQ Links: Profile News Message Board | |
| Charts:- Daily , Weekly | |
| Add BQ to Watchlist: View: Get Complete BQ Trend Analysis ➞ | |
 | XPEV XPeng Inc. |
| Sector: Services & Goods | |
| SubSector: Auto Manufacturers | |
| MarketCap: 32917 Millions | |
| Recent Price: 7.04 Market Intelligence Score: 10 | |
| Day Percent Change: -1.74% Day Change: -0.13 | |
| Week Change: -5.56% Year-to-date Change: -51.7% | |
| XPEV Links: Profile News Message Board | |
| Charts:- Daily , Weekly | |
| Add XPEV to Watchlist: View: Get Complete XPEV Trend Analysis ➞ | |
 | YQ 17 Education & Technology Group Inc. |
| Sector: Consumer Staples | |
| SubSector: Education & Training Services | |
| MarketCap: 32347 Millions | |
| Recent Price: 2.46 Market Intelligence Score: 58 | |
| Day Percent Change: 1.44% Day Change: 0.03 | |
| Week Change: -5.19% Year-to-date Change: 20.8% | |
| YQ Links: Profile News Message Board | |
| Charts:- Daily , Weekly | |
| Add YQ to Watchlist: View: Get Complete YQ Trend Analysis ➞ | |
 | EDTK Skillful Craftsman Education Technology Limited |
| Sector: Consumer Staples | |
| SubSector: Education & Training Services | |
| MarketCap: 32347 Millions | |
| Recent Price: 0.92 Market Intelligence Score: 18 | |
| Day Percent Change: -0.54% Day Change: -0.01 | |
| Week Change: -0.54% Year-to-date Change: -27.4% | |
| EDTK Links: Profile News Message Board | |
| Charts:- Daily , Weekly | |
| Add EDTK to Watchlist: View: Get Complete EDTK Trend Analysis ➞ | |
 | CLEU China Liberal Education Holdings Limited |
| Sector: Consumer Staples | |
| SubSector: Education & Training Services | |
| MarketCap: 32347 Millions | |
| Recent Price: 1.03 Market Intelligence Score: 49 | |
| Day Percent Change: 3.08% Day Change: 0.03 | |
| Week Change: 6.27% Year-to-date Change: 476.5% | |
| CLEU Links: Profile News Message Board | |
| Charts:- Daily , Weekly | |
| Add CLEU to Watchlist: View: Get Complete CLEU Trend Analysis ➞ | |
 | IBN ICICI Bank Limited |
| Sector: Financials | |
| SubSector: Money Center Banks | |
| MarketCap: 31194.1 Millions | |
| Recent Price: 25.68 Market Intelligence Score: 61 | |
| Day Percent Change: 0.98% Day Change: 0.25 | |
| Week Change: -1.76% Year-to-date Change: 7.7% | |
| IBN Links: Profile News Message Board | |
| Charts:- Daily , Weekly | |
| Add IBN to Watchlist: View: Get Complete IBN Trend Analysis ➞ | |
 | TAL TAL Education Group |
| Sector: Services & Goods | |
| SubSector: Education & Training Services | |
| MarketCap: 30103.1 Millions | |
| Recent Price: 11.43 Market Intelligence Score: 73 | |
| Day Percent Change: -1.89% Day Change: -0.22 | |
| Week Change: -2.31% Year-to-date Change: -9.5% | |
| TAL Links: Profile News Message Board | |
| Charts:- Daily , Weekly | |
| Add TAL to Watchlist: View: Get Complete TAL Trend Analysis ➞ | |
 | HDB HDFC Bank Limited |
| Sector: Financials | |
| SubSector: Foreign Regional Banks | |
| MarketCap: 29894.1 Millions | |
| Recent Price: 59.05 Market Intelligence Score: 93 | |
| Day Percent Change: 2.91% Day Change: 1.67 | |
| Week Change: 3.51% Year-to-date Change: -12.0% | |
| HDB Links: Profile News Message Board | |
| Charts:- Daily , Weekly | |
| Add HDB to Watchlist: View: Get Complete HDB Trend Analysis ➞ | |
 | LI Li Auto Inc. |
| Sector: Services & Goods | |
| SubSector: Auto Manufacturers | |
| MarketCap: 29167 Millions | |
| Recent Price: 27.21 Market Intelligence Score: 0 | |
| Day Percent Change: -6.78% Day Change: -1.98 | |
| Week Change: -7.42% Year-to-date Change: -27.3% | |
| LI Links: Profile News Message Board | |
| Charts:- Daily , Weekly | |
| Add LI to Watchlist: View: Get Complete LI Trend Analysis ➞ | |
 | CHT Chunghwa Telecom Co., Ltd. |
| Sector: Technology | |
| SubSector: Telecom Services - Domestic | |
| MarketCap: 28101.3 Millions | |
| Recent Price: 37.85 Market Intelligence Score: 13 | |
| Day Percent Change: -0.81% Day Change: -0.31 | |
| Week Change: -1.69% Year-to-date Change: -3.1% | |
| CHT Links: Profile News Message Board | |
| Charts:- Daily , Weekly | |
| Add CHT to Watchlist: View: Get Complete CHT Trend Analysis ➞ | |
 | MFG Mizuho Financial Group, Inc. |
| Sector: Financials | |
| SubSector: Foreign Regional Banks | |
| MarketCap: 27893.1 Millions | |
| Recent Price: 3.85 Market Intelligence Score: 43 | |
| Day Percent Change: 0.26% Day Change: 0.01 | |
| Week Change: -1.53% Year-to-date Change: 11.9% | |
| MFG Links: Profile News Message Board | |
| Charts:- Daily , Weekly | |
| Add MFG to Watchlist: View: Get Complete MFG Trend Analysis ➞ | |
 | BNR Burning Rock Biotech Limited |
| Sector: Health Care | |
| SubSector: Diagnostics & Research | |
| MarketCap: 27887 Millions | |
| Recent Price: 0.80 Market Intelligence Score: 54 | |
| Day Percent Change: 3.52% Day Change: 0.03 | |
| Week Change: 5.26% Year-to-date Change: -17.1% | |
| BNR Links: Profile News Message Board | |
| Charts:- Daily , Weekly | |
| Add BNR to Watchlist: View: Get Complete BNR Trend Analysis ➞ | |
 | IMAB I Mab |
| Sector: Health Care | |
| SubSector: Biotechnology | |
| MarketCap: 26187 Millions | |
| Recent Price: 1.81 Market Intelligence Score: 63 | |
| Day Percent Change: 0.56% Day Change: 0.01 | |
| Week Change: 0% Year-to-date Change: -4.7% | |
| IMAB Links: Profile News Message Board | |
| Charts:- Daily , Weekly | |
| Add IMAB to Watchlist: View: Get Complete IMAB Trend Analysis ➞ | |
 | ZTO ZTO Express (Cayman) Inc. |
| Sector: Transports | |
| SubSector: Air Delivery & Freight Services | |
| MarketCap: 20507 Millions | |
| Recent Price: 19.94 Market Intelligence Score: 68 | |
| Day Percent Change: -0.30% Day Change: -0.06 | |
| Week Change: 3.53% Year-to-date Change: -6.3% | |
| ZTO Links: Profile News Message Board | |
| Charts:- Daily , Weekly | |
| Add ZTO to Watchlist: View: Get Complete ZTO Trend Analysis ➞ | |
 | EDU New Oriental Education & Technology Group Inc. |
| Sector: Services & Goods | |
| SubSector: Education & Training Services | |
| MarketCap: 18673.7 Millions | |
| Recent Price: 84.99 Market Intelligence Score: 41 | |
| Day Percent Change: -2.19% Day Change: -1.90 | |
| Week Change: -1.81% Year-to-date Change: 16.0% | |
| EDU Links: Profile News Message Board | |
| Charts:- Daily , Weekly | |
| Add EDU to Watchlist: View: Get Complete EDU Trend Analysis ➞ | |
 | YUMC Yum China Holdings, Inc. |
| Sector: Services & Goods | |
| SubSector: Restaurants | |
| MarketCap: 16284.5 Millions | |
| Recent Price: 37.10 Market Intelligence Score: 61 | |
| Day Percent Change: -0.32% Day Change: -0.12 | |
| Week Change: -0.64% Year-to-date Change: -12.6% | |
| YUMC Links: Profile News Message Board | |
| Charts:- Daily , Weekly | |
| Add YUMC to Watchlist: View: Get Complete YUMC Trend Analysis ➞ | |
 | TME Tencent Music Entertainment Group |
| Sector: Technology | |
| SubSector: Internet Information Providers | |
| MarketCap: 16195 Millions | |
| Recent Price: 11.36 Market Intelligence Score: 61 | |
| Day Percent Change: -1.90% Day Change: -0.22 | |
| Week Change: -0.09% Year-to-date Change: 26.1% | |
| TME Links: Profile News Message Board | |
| Charts:- Daily , Weekly | |
| Add TME to Watchlist: View: Get Complete TME Trend Analysis ➞ | |
 | IX ORIX Corporation |
| Sector: Financials | |
| SubSector: Credit Services | |
| MarketCap: 15483.4 Millions | |
| Recent Price: 101.44 Market Intelligence Score: 36 | |
| Day Percent Change: -0.30% Day Change: -0.31 | |
| Week Change: -4.02% Year-to-date Change: 8.6% | |
| IX Links: Profile News Message Board | |
| Charts:- Daily , Weekly | |
| Add IX to Watchlist: View: Get Complete IX Trend Analysis ➞ | |
 | NMR Nomura Holdings, Inc. |
| Sector: Financials | |
| SubSector: Investment Brokerage - National | |
| MarketCap: 15277 Millions | |
| Recent Price: 5.77 Market Intelligence Score: 23 | |
| Day Percent Change: -1.70% Day Change: -0.10 | |
| Week Change: -5.56% Year-to-date Change: 27.9% | |
| NMR Links: Profile News Message Board | |
| Charts:- Daily , Weekly | |
| Add NMR to Watchlist: View: Get Complete NMR Trend Analysis ➞ | |
 | WIT Wipro Limited |
| Sector: Technology | |
| SubSector: Information Technology Services | |
| MarketCap: 15101.3 Millions | |
| Recent Price: 5.25 Market Intelligence Score: 17 | |
| Day Percent Change: 1.74% Day Change: 0.09 | |
| Week Change: -3.85% Year-to-date Change: -5.8% | |
| WIT Links: Profile News Message Board | |
| Charts:- Daily , Weekly | |
| Add WIT to Watchlist: View: Get Complete WIT Trend Analysis ➞ | |
 | IQ iQIYI, Inc. |
| Sector: Technology | |
| SubSector: Internet Information Providers | |
| MarketCap: 13591.5 Millions | |
| Recent Price: 4.09 Market Intelligence Score: 39 | |
| Day Percent Change: -2.74% Day Change: -0.12 | |
| Week Change: -0.85% Year-to-date Change: -16.3% | |
| IQ Links: Profile News Message Board | |
| Charts:- Daily , Weekly | |
| Add IQ to Watchlist: View: Get Complete IQ Trend Analysis ➞ | |
 | TCOM Trip.com Group Limited |
| Sector: Services & Goods | |
| SubSector: Lodging | |
| MarketCap: 13449.6 Millions | |
| Recent Price: 48.00 Market Intelligence Score: 51 | |
| Day Percent Change: -1.48% Day Change: -0.72 | |
| Week Change: -1.74% Year-to-date Change: 33.3% | |
| TCOM Links: Profile News Message Board | |
| Charts:- Daily , Weekly | |
| Add TCOM to Watchlist: View: Get Complete TCOM Trend Analysis ➞ | |
 | LXEH Lixiang Education Holding Co., Ltd. |
| Sector: Consumer Staples | |
| SubSector: Education & Training Services | |
| MarketCap: 12347 Millions | |
| Recent Price: 0.41 Market Intelligence Score: 35 | |
| Day Percent Change: 2.00% Day Change: 0.01 | |
| Week Change: -6.62% Year-to-date Change: -62.3% | |
| LXEH Links: Profile News Message Board | |
| Charts:- Daily , Weekly | |
| Add LXEH to Watchlist: View: Get Complete LXEH Trend Analysis ➞ | |
 | IH iHuman Inc. |
| Sector: Consumer Staples | |
| SubSector: Education & Training Services | |
| MarketCap: 12247 Millions | |
| Recent Price: 1.73 Market Intelligence Score: 25 | |
| Day Percent Change: 0.99% Day Change: 0.02 | |
| Week Change: -2.7% Year-to-date Change: -43.2% | |
| IH Links: Profile News Message Board | |
| Charts:- Daily , Weekly | |
| Add IH to Watchlist: View: Get Complete IH Trend Analysis ➞ | |
 | YSG Yatsen Holding Limited |
| Sector: Services & Goods | |
| SubSector: Specialty Retail | |
| MarketCap: 11827 Millions | |
| Recent Price: 3.62 Market Intelligence Score: 76 | |
| Day Percent Change: 0.98% Day Change: 0.04 | |
| Week Change: 20.1% Year-to-date Change: 394.1% | |
| YSG Links: Profile News Message Board | |
| Charts:- Daily , Weekly | |
| Add YSG to Watchlist: View: Get Complete YSG Trend Analysis ➞ | |
| To view more stocks, click on Next / Previous arrows or select different range: 0 - 25 , 25 - 50 , 50 - 75 , 75 - 100 , 100 - 125 , 125 - 150 , 150 - 175 , 175 - 200 , 200 - 225 | ||
| Click To Change The Sort Order: By Market Cap or Company Size Performance: Year-to-date, Week and Day | |
| Select Chart Type: | ||
|
Best Stocks Today 12Stocks.com |
© 2024 12Stocks.com Terms & Conditions Privacy Contact Us
All Information Provided Only For Education And Not To Be Used For Investing or Trading. See Terms & Conditions


One More Thing ... Get Best Stocks Delivered Daily!
Never Ever Miss A Move With Our Top Ten Stocks Lists
Find Best Stocks In Any Market - Bull or Bear Market
Take A Peek At Our Top Ten Stocks Lists: Daily, Weekly, Year-to-Date & Top Trends
Find Best Stocks In Any Market - Bull or Bear Market
Take A Peek At Our Top Ten Stocks Lists: Daily, Weekly, Year-to-Date & Top Trends
Asia Stocks With Best Up Trends [0-bearish to 100-bullish]: HDFC Bank[93], Full Truck[93], DouYu [90], GDS [88], Bright Scholar[85], MOGU [83], Lufax Holding[83], So-Young [83], U Power[76], Yatsen Holding[76], MingZhu Logistics[74]
Best Asia Stocks Year-to-Date:
U Power[2768.3%], DouYu [747.37%], MicroCloud Hologram[702.88%], China Liberal[476.51%], Zhongchao [412.19%], Yatsen Holding[394.12%], Uxin [141.08%], QuantaSing [106.79%], GigaCloud [89.46%], Bright Scholar[60.8%], Cheetah Mobile[55.26%] Best Asia Stocks This Week:
Regencell Bioscience[45.67%], Yatsen Holding[20.1%], MingZhu Logistics[17.48%], Secoo Holding[17.14%], Zhongchao [14.02%], TH [11.82%], Bright Scholar[9.24%], Quhuo [8.87%], Smart Share[7.58%], DouYu [6.62%], China Liberal[6.27%] Best Asia Stocks Daily:
Lanvin [11.19%], MingZhu Logistics[10.31%], Bright Scholar[6.91%], Regencell Bioscience[6.32%], MOGU [5.85%], Cheetah Mobile[5.04%], Secoo Holding[4.75%], Burning Rock[3.52%], Boqii Holding[3.47%], GreenTree Hospitality[3.43%], China Liberal[3.08%]