
 Login Sign Up


| |||||
 |  | ||||

| 12Stocks.com Market Intelligence |
Best Asia Stocks
|
|
| Quick Read: Top Asia Stocks By Performances & Trends: Daily, Weekly, Year-to-Date, Market Cap (Size) & Technical Trends | |||
| Best Asia Views: Quick Browse View, Summary & Slide Show | |||
| 12Stocks.com Asia Stocks Performances & Trends Daily | |||||||||
|
|  The overall market intelligence score is 26 (0-bearish to 100-bullish) which puts Asia index in short term bearish to neutral trend. The market intelligence score from previous trading session is 56 and a deterioration of trend continues.
| ||||||||
Here are the market intelligence trend scores of the most requested Asia stocks at 12Stocks.com (click stock name for detailed review):
|


| Consider signing up for our daily 12Stocks.com "Best Stocks Newsletter". You will never ever miss a big stock move again! |
| 12Stocks.com: Top Performing Asia Index Stocks | ||||||||||||||||||||||||||||||||||||||||||||||||
 The top performing Asia Index stocks year to date are
Now, more recently, over last week, the top performing Asia Index stocks on the move are


|
||||||||||||||||||||||||||||||||||||||||||||||||
| 12Stocks.com: Investing in Asia Index with Stocks | |
|
The following table helps investors and traders sort through current performance and trends (as measured by market intelligence score) of various
stocks in the Asia Index. Quick View: Move mouse or cursor over stock symbol (ticker) to view short-term technical chart and over stock name to view long term chart. Click on  to add stock symbol to your watchlist and to add stock symbol to your watchlist and  to view watchlist. Click on any ticker or stock name for detailed market intelligence report for that stock. to view watchlist. Click on any ticker or stock name for detailed market intelligence report for that stock. |
12Stocks.com Performance of Stocks in Asia Index
| Ticker | Stock Name | Watchlist | Category | Recent Price | Market Intelligence Score | Change % | Weekly Change% |
| QFIN | 360 Finance |   | Financials | 17.89 | 36 | -2.51% | -3.51% |
| MOGU | MOGU | | Services & Goods | 1.90 | 65 | 2.15% | -3.55% |
| APWC | Asia Pacific | | Industrials | 1.36 | 43 | -3.55% | -3.55% |
| OCFT | OneConnect Financial | | Technology | 1.88 | 0 | -3.09% | -3.59% |
| BZ | Kanzhun | | Industrials | 18.06 | 51 | -1.58% | -3.63% |
| WIT | Wipro | | Technology | 5.26 | 0 | -1.13% | -3.66% |
| QD | Qudian | | Technology | 2.33 | 26 | -3.32% | -3.72% |
| INFY | Infosys | | Technology | 17.05 | 0 | -1.27% | -3.78% |
| QSG | QuantaSing | | Consumer Staples | 3.23 | 20 | -0.31% | -3.87% |
| IMOS | ChipMOS | | Technology | 28.69 | 36 | -1.51% | -3.89% |
| ATHM | Autohome | | Technology | 24.25 | 0 | -1.86% | -3.92% |
| UMC | United Microelectronics | | Technology | 7.66 | 0 | -2.11% | -3.95% |
| LXEH | Lixiang Education | | Consumer Staples | 0.42 | 45 | -7.32% | -4.00% |
| TUYA | Tuya | | Technology | 1.64 | 0 | 0.00% | -4.09% |
| XPEV | XPeng | | Services & Goods | 7.15 | 10 | -0.69% | -4.16% |
| BILI | Bilibili | | Technology | 10.98 | 36 | -2.44% | -4.31% |
| APM | Aptorum | | Health Care | 7.85 | 36 | 0.00% | -4.38% |
| KC | Kingsoft Cloud | | Technology | 2.58 | 0 | -0.39% | -4.44% |
| YTRA | Yatra Online | | Industrials | 1.45 | 10 | 2.84% | -4.61% |
| DTSS | Datasea | | Industrials | 7.98 | 69 | -2.85% | -4.66% |
| GHG | GreenTree Hospitality | | Services & Goods | 2.92 | 0 | -3.25% | -4.67% |
| VIOT | Viomi | | Technology | 0.52 | 17 | -1.41% | -4.93% |
| CHNR | China Natural | | Materials | 1.12 | 26 | -5.08% | -5.08% |
| BGNE | BeiGene | | Health Care | 134.08 | 0 | -3.12% | -5.11% |
| HKD | AMTD Digital | | Technology | 3.19 | 10 | 1.76% | -5.21% |
| To view more stocks, click on Next / Previous arrows or select different range: 0 - 25 , 25 - 50 , 50 - 75 , 75 - 100 , 100 - 125 , 125 - 150 , 150 - 175 , 175 - 200 , 200 - 225 | ||
 | Click To Change The Sort Order: By Market Cap or Company Size Performance: Year-to-date, Week and Day |  |
|
Get the most comprehensive stock market coverage daily at 12Stocks.com ➞ Best Stocks Today ➞ Best Stocks Weekly ➞ Best Stocks Year-to-Date ➞ Best Stocks Trends ➞  Best Stocks Today 12Stocks.com Best Nasdaq Stocks ➞ Best S&P 500 Stocks ➞ Best Tech Stocks ➞ Best Biotech Stocks ➞ |
| Detailed Overview of Asia Stocks |
| Asia Technical Overview, Leaders & Laggards, Top Asia ETF Funds & Detailed Asia Stocks List, Charts, Trends & More |
| Asia: Technical Analysis, Trends & YTD Performance | |
 VPL Weekly Chart |
|
| Long Term Trend: Good | |
| Medium Term Trend: Not Good | |
 VPL Daily Chart |
|
| Short Term Trend: Not Good | |
| Overall Trend Score: 26 | |
| YTD Performance: 0.04% | |
| **Trend Scores & Views Are Only For Educational Purposes And Not For Investing | |
| 12Stocks.com: Investing in Asia Index using Exchange Traded Funds | |
|
The following table shows list of key exchange traded funds (ETF) that
help investors play Asia stock market. For detailed view, check out our ETF Funds section of our website. Quick View: Move mouse or cursor over ETF symbol (ticker) to view short-term technical chart and over ETF name to view long term chart. Click on ticker or stock name for detailed view. Click on to add stock symbol to your watchlist and to view watchlist. |
12Stocks.com List of ETFs that track Asia Index
| Ticker | ETF Name | Watchlist | Recent Price | Market Intelligence Score | Change % | Week % | Year-to-date % |
| VPL | Pacific | | 72.06 | 26 | -1.57 | -2.12 | 0.04% |
| EEMA | Emerging Markets Asia | | 66.19 | 36 | -1.70 | -1.7 | 0.12% |
| AIA | Asia 50 | | 58.79 | 36 | -2.83 | -2.24 | 1.41% |
| AAXJ | All Country Asia | | 65.62 | 31 | -1.12 | -1.75 | -1.43% |
| GMF | Emerging Asia Pacific | | 101.51 | 31 | -1.77 | -1.83 | 0.44% |
| EPP | Pacific ex Japan | | 40.56 | 0 | -1.72 | -2.59 | -6.57% |
| ASEA | Southeast Asia | | 14.40 | 0 | -1.84 | -1.99 | -4.52% |
| DVYA | Asia/Pacific Dividend | | 35.14 | 0 | -2.50 | -1.8 | -1.73% |
| IPAC | Core Pacific | | 60.24 | 26 | -2.35 | -2.03 | 1.23% |
| FXI | China Large-Cap | | 23.65 | 36 | -1.13 | -0.8 | -1.58% |
| EWY | South Korea | | 61.32 | 26 | -1.51 | -2.06 | -6.42% |
| EWT | Taiwan | | 46.60 | 31 | -2.22 | -3.66 | 1.24% |
| EWJ | Japan | | 67.81 | 26 | -1.39 | -1.8 | 5.73% |
| EWH | Hong Kong | | 14.67 | 0 | -1.87 | -3.23 | -15.54% |
| EWS | Singapore | | 17.83 | 26 | -0.39 | -1.6 | -4.65% |
| EWM | Malaysia | | 21.47 | 31 | -0.42 | -0.79 | 1.04% |
| EPHE | Philippines | | 24.90 | 0 | -2.16 | -4.27 | -4.19% |
| EIDO | Indonesia | | 20.92 | 0 | -2.61 | -2.52 | -6.27% |
| THD | Thailand | | 58.87 | 42 | 0.11 | -0.17 | -7.81% |
| VNM | Vietnam | | 12.42 | 0 | -1.04 | -6.33 | -3.87% |
| 12Stocks.com: Charts, Trends, Fundamental Data and Performances of Asia Stocks | |
|
We now take in-depth look at all Asia stocks including charts, multi-period performances and overall trends (as measured by market intelligence score). One can sort Asia stocks (click link to choose) by Daily, Weekly and by Year-to-Date performances. Also, one can sort by size of the company or by market capitalization. |
| Select Your Default Chart Type: | |||||
| |||||
| Click on stock symbol or name for detailed view. Click on to add stock symbol to your watchlist and to view watchlist. Quick View: Move mouse or cursor over "Daily" to quickly view daily technical stock chart and over "Weekly" to view weekly technical stock chart. | |||||

 | QFIN 360 Finance, Inc. |
| Sector: Financials | |
| SubSector: Credit Services | |
| MarketCap: 956.208 Millions | |
| Recent Price: 17.89 Market Intelligence Score: 36 | |
| Day Percent Change: -2.51% Day Change: -0.46 | |
| Week Change: -3.51% Year-to-date Change: 13.1% | |
| QFIN Links: Profile News Message Board | |
| Charts:- Daily , Weekly | |
| Add QFIN to Watchlist: View: Get Complete QFIN Trend Analysis ➞ | |
 | MOGU MOGU Inc. |
| Sector: Services & Goods | |
| SubSector: Specialty Retail, Other | |
| MarketCap: 168.844 Millions | |
| Recent Price: 1.90 Market Intelligence Score: 65 | |
| Day Percent Change: 2.15% Day Change: 0.04 | |
| Week Change: -3.55% Year-to-date Change: -0.5% | |
| MOGU Links: Profile News Message Board | |
| Charts:- Daily , Weekly | |
| Add MOGU to Watchlist: View: Get Complete MOGU Trend Analysis ➞ | |
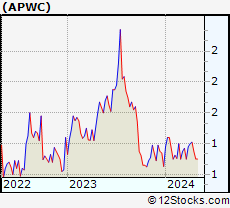 | APWC Asia Pacific Wire & Cable Corporation Limited |
| Sector: Industrials | |
| SubSector: Industrial Electrical Equipment | |
| MarketCap: 13.4879 Millions | |
| Recent Price: 1.36 Market Intelligence Score: 43 | |
| Day Percent Change: -3.55% Day Change: -0.05 | |
| Week Change: -3.55% Year-to-date Change: 8.6% | |
| APWC Links: Profile News Message Board | |
| Charts:- Daily , Weekly | |
| Add APWC to Watchlist: View: Get Complete APWC Trend Analysis ➞ | |
 | OCFT OneConnect Financial Technology Co., Ltd. |
| Sector: Technology | |
| SubSector: Software Application | |
| MarketCap: 80387 Millions | |
| Recent Price: 1.88 Market Intelligence Score: 0 | |
| Day Percent Change: -3.09% Day Change: -0.06 | |
| Week Change: -3.59% Year-to-date Change: -40.3% | |
| OCFT Links: Profile News Message Board | |
| Charts:- Daily , Weekly | |
| Add OCFT to Watchlist: View: Get Complete OCFT Trend Analysis ➞ | |
 | BZ Kanzhun Limited |
| Sector: Industrials | |
| SubSector: Staffing & Employment Services | |
| MarketCap: 6680 Millions | |
| Recent Price: 18.06 Market Intelligence Score: 51 | |
| Day Percent Change: -1.58% Day Change: -0.29 | |
| Week Change: -3.63% Year-to-date Change: 9.3% | |
| BZ Links: Profile News Message Board | |
| Charts:- Daily , Weekly | |
| Add BZ to Watchlist: View: Get Complete BZ Trend Analysis ➞ | |
 | WIT Wipro Limited |
| Sector: Technology | |
| SubSector: Information Technology Services | |
| MarketCap: 15101.3 Millions | |
| Recent Price: 5.26 Market Intelligence Score: 0 | |
| Day Percent Change: -1.13% Day Change: -0.06 | |
| Week Change: -3.66% Year-to-date Change: -5.6% | |
| WIT Links: Profile News Message Board | |
| Charts:- Daily , Weekly | |
| Add WIT to Watchlist: View: Get Complete WIT Trend Analysis ➞ | |
 | QD Qudian Inc. |
| Sector: Technology | |
| SubSector: Information Technology Services | |
| MarketCap: 544.968 Millions | |
| Recent Price: 2.33 Market Intelligence Score: 26 | |
| Day Percent Change: -3.32% Day Change: -0.08 | |
| Week Change: -3.72% Year-to-date Change: 14.2% | |
| QD Links: Profile News Message Board | |
| Charts:- Daily , Weekly | |
| Add QD to Watchlist: View: Get Complete QD Trend Analysis ➞ | |
 | INFY Infosys Limited |
| Sector: Technology | |
| SubSector: Information Technology Services | |
| MarketCap: 33819.1 Millions | |
| Recent Price: 17.05 Market Intelligence Score: 0 | |
| Day Percent Change: -1.27% Day Change: -0.22 | |
| Week Change: -3.78% Year-to-date Change: -7.2% | |
| INFY Links: Profile News Message Board | |
| Charts:- Daily , Weekly | |
| Add INFY to Watchlist: View: Get Complete INFY Trend Analysis ➞ | |
 | QSG QuantaSing Group Limited |
| Sector: Consumer Staples | |
| SubSector: Education & Training Services | |
| MarketCap: 433 Millions | |
| Recent Price: 3.23 Market Intelligence Score: 20 | |
| Day Percent Change: -0.31% Day Change: -0.01 | |
| Week Change: -3.87% Year-to-date Change: 99.4% | |
| QSG Links: Profile News Message Board | |
| Charts:- Daily , Weekly | |
| Add QSG to Watchlist: View: Get Complete QSG Trend Analysis ➞ | |
 | IMOS ChipMOS TECHNOLOGIES INC. |
| Sector: Technology | |
| SubSector: Semiconductor Equipment & Materials | |
| MarketCap: 658.918 Millions | |
| Recent Price: 28.69 Market Intelligence Score: 36 | |
| Day Percent Change: -1.51% Day Change: -0.44 | |
| Week Change: -3.89% Year-to-date Change: 5.4% | |
| IMOS Links: Profile News Message Board | |
| Charts:- Daily , Weekly | |
| Add IMOS to Watchlist: View: Get Complete IMOS Trend Analysis ➞ | |
 | ATHM Autohome Inc. |
| Sector: Technology | |
| SubSector: Internet Information Providers | |
| MarketCap: 7984.2 Millions | |
| Recent Price: 24.25 Market Intelligence Score: 0 | |
| Day Percent Change: -1.86% Day Change: -0.46 | |
| Week Change: -3.92% Year-to-date Change: -13.6% | |
| ATHM Links: Profile News Message Board | |
| Charts:- Daily , Weekly | |
| Add ATHM to Watchlist: View: Get Complete ATHM Trend Analysis ➞ | |
 | UMC United Microelectronics Corporation |
| Sector: Technology | |
| SubSector: Semiconductor Equipment & Materials | |
| MarketCap: 5672.78 Millions | |
| Recent Price: 7.66 Market Intelligence Score: 0 | |
| Day Percent Change: -2.11% Day Change: -0.17 | |
| Week Change: -3.95% Year-to-date Change: -9.5% | |
| UMC Links: Profile News Message Board | |
| Charts:- Daily , Weekly | |
| Add UMC to Watchlist: View: Get Complete UMC Trend Analysis ➞ | |
 | LXEH Lixiang Education Holding Co., Ltd. |
| Sector: Consumer Staples | |
| SubSector: Education & Training Services | |
| MarketCap: 12347 Millions | |
| Recent Price: 0.42 Market Intelligence Score: 45 | |
| Day Percent Change: -7.32% Day Change: -0.03 | |
| Week Change: -4% Year-to-date Change: -61.2% | |
| LXEH Links: Profile News Message Board | |
| Charts:- Daily , Weekly | |
| Add LXEH to Watchlist: View: Get Complete LXEH Trend Analysis ➞ | |
 | TUYA Tuya Inc. |
| Sector: Technology | |
| SubSector: Software - Infrastructure | |
| MarketCap: 1050 Millions | |
| Recent Price: 1.64 Market Intelligence Score: 0 | |
| Day Percent Change: 0.00% Day Change: 0.00 | |
| Week Change: -4.09% Year-to-date Change: -28.5% | |
| TUYA Links: Profile News Message Board | |
| Charts:- Daily , Weekly | |
| Add TUYA to Watchlist: View: Get Complete TUYA Trend Analysis ➞ | |
 | XPEV XPeng Inc. |
| Sector: Services & Goods | |
| SubSector: Auto Manufacturers | |
| MarketCap: 32917 Millions | |
| Recent Price: 7.15 Market Intelligence Score: 10 | |
| Day Percent Change: -0.69% Day Change: -0.05 | |
| Week Change: -4.16% Year-to-date Change: -51.0% | |
| XPEV Links: Profile News Message Board | |
| Charts:- Daily , Weekly | |
| Add XPEV to Watchlist: View: Get Complete XPEV Trend Analysis ➞ | |
 | BILI Bilibili Inc. |
| Sector: Technology | |
| SubSector: Internet Information Providers | |
| MarketCap: 7043.1 Millions | |
| Recent Price: 10.98 Market Intelligence Score: 36 | |
| Day Percent Change: -2.44% Day Change: -0.28 | |
| Week Change: -4.31% Year-to-date Change: -9.7% | |
| BILI Links: Profile News Message Board | |
| Charts:- Daily , Weekly | |
| Add BILI to Watchlist: View: Get Complete BILI Trend Analysis ➞ | |
 | APM Aptorum Group Limited |
| Sector: Health Care | |
| SubSector: Biotechnology | |
| MarketCap: 88.7785 Millions | |
| Recent Price: 7.85 Market Intelligence Score: 36 | |
| Day Percent Change: 0.00% Day Change: 0.00 | |
| Week Change: -4.38% Year-to-date Change: 220.6% | |
| APM Links: Profile News Message Board | |
| Charts:- Daily , Weekly | |
| Add APM to Watchlist: View: Get Complete APM Trend Analysis ➞ | |
 | KC Kingsoft Cloud Holdings Limited |
| Sector: Technology | |
| SubSector: Software Application | |
| MarketCap: 98487 Millions | |
| Recent Price: 2.58 Market Intelligence Score: 0 | |
| Day Percent Change: -0.39% Day Change: -0.01 | |
| Week Change: -4.44% Year-to-date Change: -31.8% | |
| KC Links: Profile News Message Board | |
| Charts:- Daily , Weekly | |
| Add KC to Watchlist: View: Get Complete KC Trend Analysis ➞ | |
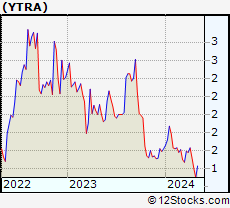 | YTRA Yatra Online, Inc. |
| Sector: Industrials | |
| SubSector: Conglomerates | |
| MarketCap: 54.2848 Millions | |
| Recent Price: 1.45 Market Intelligence Score: 10 | |
| Day Percent Change: 2.84% Day Change: 0.04 | |
| Week Change: -4.61% Year-to-date Change: -10.5% | |
| YTRA Links: Profile News Message Board | |
| Charts:- Daily , Weekly | |
| Add YTRA to Watchlist: View: Get Complete YTRA Trend Analysis ➞ | |
 | DTSS Datasea Inc. |
| Sector: Industrials | |
| SubSector: Conglomerates | |
| MarketCap: 36.8848 Millions | |
| Recent Price: 7.98 Market Intelligence Score: 69 | |
| Day Percent Change: -2.85% Day Change: -0.23 | |
| Week Change: -4.66% Year-to-date Change: 3,339.7% | |
| DTSS Links: Profile News Message Board | |
| Charts:- Daily , Weekly | |
| Add DTSS to Watchlist: View: Get Complete DTSS Trend Analysis ➞ | |
 | GHG GreenTree Hospitality Group Ltd. |
| Sector: Services & Goods | |
| SubSector: Lodging | |
| MarketCap: 1195.36 Millions | |
| Recent Price: 2.92 Market Intelligence Score: 0 | |
| Day Percent Change: -3.25% Day Change: -0.10 | |
| Week Change: -4.67% Year-to-date Change: -22.4% | |
| GHG Links: Profile News Message Board | |
| Charts:- Daily , Weekly | |
| Add GHG to Watchlist: View: Get Complete GHG Trend Analysis ➞ | |
 | VIOT Viomi Technology Co., Ltd |
| Sector: Technology | |
| SubSector: Electronic Equipment | |
| MarketCap: 357.2 Millions | |
| Recent Price: 0.52 Market Intelligence Score: 17 | |
| Day Percent Change: -1.41% Day Change: -0.01 | |
| Week Change: -4.93% Year-to-date Change: -47.7% | |
| VIOT Links: Profile News Message Board | |
| Charts:- Daily , Weekly | |
| Add VIOT to Watchlist: View: Get Complete VIOT Trend Analysis ➞ | |
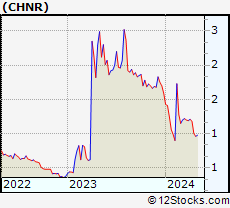 | CHNR China Natural Resources, Inc. |
| Sector: Materials | |
| SubSector: Industrial Metals & Minerals | |
| MarketCap: 21.691 Millions | |
| Recent Price: 1.12 Market Intelligence Score: 26 | |
| Day Percent Change: -5.08% Day Change: -0.06 | |
| Week Change: -5.08% Year-to-date Change: -29.7% | |
| CHNR Links: Profile News Message Board | |
| Charts:- Daily , Weekly | |
| Add CHNR to Watchlist: View: Get Complete CHNR Trend Analysis ➞ | |
 | BGNE BeiGene, Ltd. |
| Sector: Health Care | |
| SubSector: Biotechnology | |
| MarketCap: 10838.5 Millions | |
| Recent Price: 134.08 Market Intelligence Score: 0 | |
| Day Percent Change: -3.12% Day Change: -4.32 | |
| Week Change: -5.11% Year-to-date Change: -25.7% | |
| BGNE Links: Profile News Message Board | |
| Charts:- Daily , Weekly | |
| Add BGNE to Watchlist: View: Get Complete BGNE Trend Analysis ➞ | |
 | HKD AMTD Digital Inc. |
| Sector: Technology | |
| SubSector: Software - Application | |
| MarketCap: 1200 Millions | |
| Recent Price: 3.19 Market Intelligence Score: 10 | |
| Day Percent Change: 1.76% Day Change: 0.06 | |
| Week Change: -5.21% Year-to-date Change: -22.9% | |
| HKD Links: Profile News Message Board | |
| Charts:- Daily , Weekly | |
| Add HKD to Watchlist: View: Get Complete HKD Trend Analysis ➞ | |
| To view more stocks, click on Next / Previous arrows or select different range: 0 - 25 , 25 - 50 , 50 - 75 , 75 - 100 , 100 - 125 , 125 - 150 , 150 - 175 , 175 - 200 , 200 - 225 | ||
| Click To Change The Sort Order: By Market Cap or Company Size Performance: Year-to-date, Week and Day | |
| Select Chart Type: | ||
|
Best Stocks Today 12Stocks.com |
© 2024 12Stocks.com Terms & Conditions Privacy Contact Us
All Information Provided Only For Education And Not To Be Used For Investing or Trading. See Terms & Conditions


One More Thing ... Get Best Stocks Delivered Daily!
Never Ever Miss A Move With Our Top Ten Stocks Lists
Find Best Stocks In Any Market - Bull or Bear Market
Take A Peek At Our Top Ten Stocks Lists: Daily, Weekly, Year-to-Date & Top Trends
Find Best Stocks In Any Market - Bull or Bear Market
Take A Peek At Our Top Ten Stocks Lists: Daily, Weekly, Year-to-Date & Top Trends
Asia Stocks With Best Up Trends [0-bearish to 100-bullish]: Yatsen Holding[100], Studio City[93], So-Young [90], DouYu [90], Cheetah Mobile[83], Trip.com [70], Perfect [68], Niu [68], SunCar [67], U Power[66], MOGU [65]
Best Asia Stocks Year-to-Date:
U Power[2433.48%], DouYu [722.11%], MicroCloud Hologram[582.01%], China Liberal[459.12%], Yatsen Holding[390.71%], Zhongchao [283.46%], Uxin [128.25%], QuantaSing [99.38%], GigaCloud [91.43%], Cheetah Mobile[74.56%], Bright Scholar[55.2%] Best Asia Stocks This Week:
Yatsen Holding[19.27%], SunCar [8%], Burning Rock[7.76%], Shengfeng Development[5.56%], Bright Scholar[5.43%], Momo [4.91%], Secoo Holding[4.45%], GigaCloud [3.71%], DouYu [3.44%], China Liberal[3.06%], SYLA [3.01%] Best Asia Stocks Daily:
GigaCloud [7.95%], WiMi Hologram[7.47%], SunCar [6.48%], Bright Scholar[6.01%], Yatsen Holding[5.90%], So-Young [3.15%], SYLA [3.01%], Boqii Holding[2.96%], CNFinance [2.78%], Youdao [2.62%], China Liberal[2.45%]