


On This Page ...
Asia-Pacific ETFs
Performance & Trends
Top Asia-Pacific ETFs
Investing with Asia-Pacific ETFs
Detailed View: Asia-Pacific ETF Lists, Charts & More
Stock Holdings in Asia-Pacific ETFs
 Asia-Pacific ETFs SlideShow Here Asia-Pacific ETFs SlideShow Here |
 Daily Weekly Year-To-Date Top Trends Daily Weekly Year-To-Date Top Trends |
 |
| Top Dow Stocks |
| Best Nasdaq Stocks |
| Best SmallCap Stocks |
| Top Sectors |
| Best China Stocks |

Best Asia-Pacific Exchange Traded Funds (ETFs)
| ||||||||||||||||||
| Detailed View: Best Asia-Pacific ETFs by Daily, Weekly, Year-to-date and Trends | ||||||||||||||||||
| Quickly Browse, Sort and Filter to Find Best Asia-Pacific ETFs Using Our Slide Show Tool | ||||||||||||||||||
| Asia-Pacific ETF Segment in Brief | ||||||||||||||||||
| Year-to-date Asia-Pacific segment is underperforming market by -5.02%. | ||||||||||||||||||
 |
||||||||||||||||||
| Year To Date Performance: -1.1 % | ||||||||||||||||||
| Weekly Performance: -0.27 % | ||||||||||||||||||
| Daily Performance: -2.02 % | ||||||||||||||||||
|
Asia-Pacific Segment Short Term Technical Trend Score: 58 Trend Score : 0(bearish) to 100(bullish). Updated daily. Not to be used for investing. |
||||||||||||||||||

| 12Stocks.com: Asia-Pacific ETF Sector - Look at Big Picture | |
 |
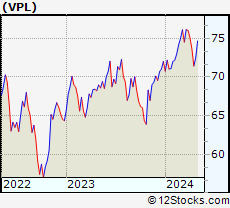
Let's take comprehensive view of Asia-Pacific segment. The Asia-Pacific segment of the Global Stock Market is best represented by VPL - exchange traded fund that tracks FTSE Developed Asia Pacific Index. It consists of top stocks
- from all major sectors - and is primarily Asia-Pacific region based. The Asia-Pacific sector contains stocks like China Mobile and Toyota. Year to date, Asia-Pacific sector as represented by VPL is down by -1.1% and is currently underperforming the market (S&P 500) by -5.02%. Next, let us look at relative performance of Asia-Pacific segment as represented by S&P Asia-Pacific 350 versus other major market segments like US stock indexes (Nasdaq 100, Dow 30, S&P 500, S&P 400 Midcap & Total Stock Market Index), emerging markets and other asset classes like bonds, gold and oil. The performances of major market segments year to date are - Oil [18.74%], Gold [12.31%], US Dollar [6.5%], US Pacific [4.7%], US Total Market [3.92%], US Mid Cap [2.97%], Emerging Markets [0.16%], US Pacific [-1.1%], Euro [-3.09%], Bonds [-4.3%], . Now, we dive deep to identify investing opportunities both with ETFs that track Asia-Pacific segment of the stock market and Asia-Pacific stock holdings contained within these ETF baskets. Check daily for updates. Scroll down this guide or just click the links below - |
 |
|
| Asia-Pacific ETFs | |
| SEGMENT | |
| PERFORMANCE | |
|
-1.1% (YEAR-TO-DATE) |
|
|
-0.27% (WEEKLY) |
|
|
-2.02% (DAILY) |
|
| 12Stocks.com: Quick View of Technicals of Overall Asia-Pacific Sector | |
| VPL : Invests to track index of 400 equities from Australia, Japan, Hong Kong, New Zealand and Singapore | |
 |
 |
| Weekly Chart | Daily Chart (Short Term) |
| Weekly: -0.27% | Daily: -2.02% |
| Year-to-date Performance : -1.1% | Relative Performance: The Asia-Pacific Index is underperforming the market (S&P 500) by -5.02% |
| 12Stocks.com: Top Performing Asia-Pacific ETFs | |
|
|
Most popular Asia-Pacific exchange traded funds track the broad Asia-Pacific sector. But there are ETF funds that track specific sub-sectors within the wide Asia-Pacific sector. For instance, most Asia-Pacific ETFs focus on broad market but there are ETFs that focus on smallcap segment. The top performing ETFs (year-to-date) that track the whole Asia-Pacific segment are shown in left side bar. The popular Asia-Pacific ETFs with Best YTD Performances: Wisdom Tree India Earnings Fund [9.12%], iShares China 25 [4.79%], iShares Malaysia [3.67%], iShares Japan [2.68%], Vanguard Emerging Markets VIPERs [0.85%], iShares Singapore [0.53%], India Closed-End ETF Fund [0.52%], iShares Emerging Mkts [0.16%], iShares Taiwan [-0.34%], Vanguard Pacific Stock VIPERs [-1.1%], iShares Australia [-4.11%]. Also, there are leveraged ETFs that given enhanced performance by moving twice or thrice the daily movement of Asia-Pacific sector Double Bull India [9.8%], Ultra China [2.95%], Ultra Emerging Mkts [-1.84%], TripleBull Emerging Markets [-7.15%]. Finally, there are inverse or bearish Asia-Pacific ETFs that move in opposite direction to the daily movement of the Asia-Pacific segment TripleShort Emerging Markets [1.29%], Short MSCI Emerging Markets [1.1%], UltraShort FTSE/Xinhua China 25 [-13.3%]. Now, more recently, over last week, the top performing Asia-Pacific ETFs that track the whole segment on the move are - Hong Kong [6.05%], China [4.87%], India CF [4.22%], Singapore [3.24%], India [1.66%], Emerging Mkts [1.42%], Emerging Mkts [1.37%], Malaysia [1.24%], Korea [1.19%], Taiwan [0.36%], Australia [-0.09%] . |
|
LEADING Asia-Pacific ETFs (YEAR-TO-DATE) |
|
| Wisdom Tree India Earnings Fund : 9.12% | |
| iShares China 25: 4.79% | |
| iShares Malaysia : 3.67% | |
| iShares Japan : 2.68% | |
| Vanguard Emerging Markets VIPERs: 0.85% | |
| iShares Singapore : 0.53% | |
| India Closed-End ETF Fund: 0.52% | |
| iShares Emerging Mkts : 0.16% | |
| iShares Taiwan : -0.34% | |
| Vanguard Pacific Stock VIPERs: -1.1% | |
|
For Complete List of Winners and Laggards from Asia-Pacific ETF
Segment
| |

| 12Stocks.com: Investing With Asia-Pacific ETFs | |
|
The following table helps investors and traders sort through current performance of various
Asia-Pacific ETFs. One can glean long and short term trends by sorting Asia-Pacific ETF list by performance over daily, weekly or year-to-date periods. |
12Stocks.com Performance of Asia-Pacific ETFs
| Ticker | Stock Name | Watchlist | Category | Recent Price | Change % | Weekly Change% | YTD Change% |
| EPI | Wisdom Tree India Earnings Fund |   | Pacific | 44.74 | 0.09 | 1.66 | 9.12% |
| FXI | iShares China 25 | | Pacific | 25.18 | -0.36 | 4.87 | 4.79% |
| EEM | iShares Emerging Mkts | | Emerging Markets | 40.27 | -0.82 | 1.42 | 0.16% |
| EWM | iShares Malaysia | | Pacific | 22.03 | -0.27 | 1.24 | 3.67% |
| EWJ | iShares Japan | | Pacific | 65.86 | -2.59 | -0.95 | 2.68% |
| VWO | Vanguard Emerging Markets VIPERs | | Emerging Markets | 41.45 | -0.62 | 1.37 | 0.85% |
| EWS | iShares Singapore | | Pacific | 18.80 | -0.42 | 3.24 | 0.53% |
| IFN | India Closed-End ETF Fund | | Pacific | 18.39 | 0.57 | 4.22 | 0.52% |
| EWT | iShares Taiwan | | Pacific | 45.88 | -1.41 | 0.36 | -0.34% |
| VPL | Vanguard Pacific Stock VIPERs | | Pacific | 71.23 | -2.02 | -0.27 | -1.1% |
| EWA | iShares Australia | | Pacific | 23.34 | -1.60 | -0.09 | -4.11% |
| EWY | iShares South Korea | | Pacific | 62.05 | -1.76 | 1.19 | -5.31% |
| EWH | iShares Hong Kong | | Pacific | 15.59 | 0.58 | 6.05 | -10.25% |
 | Showing 0 to 25 ETFs. Click on arrows to view more! Sort by performace by clicking on Daily, Weekly or YTD % Change |  | |||||
| 12Stocks.com: Euro Currency | |
| Investors using Asia-Pacific ETFs have to also deal with currency movements versus US dollar. Unless the ETF is hedged for Asia-Pacific currency exposure, traders will have to take into account the performance of Asia-Pacific currencies. |
12Stocks.com Performance of Asia-Pacific Currencies
| Ticker | ETF Name | Watchlist | Category | Recent Price | Change % | Weekly Change% | YTD Change% |
| YCS | UltraShort Yen | | Pacific | 87.39 | 0.44 | 1.46 | 26.75% |
| YCL | Ultra Yen | | Pacific | 21.97 | -0.32 | -1.35 | -20.08% |
| 12Stocks.com: Trading With Bullish (Leveraged) Asia-Pacific ETFs | |
| Traders and speculators can enhance their performances by trading leveraged ETFs that double or triple the daily returns of Asia-Pacific indexes. Also, listed below are leveraged ETFs that have exposure to Asia-Pacific economy. |
12Stocks.com Performance of Bullish (Leveraged) Asia-Pacific ETFs
| Ticker | ETF Name | Watchlist | Category | Recent Price | Change % | Weekly Change% | YTD Change% |
| INDL | Double Bull India | | Pacific | 62.37 | -0.18 | 2.51 | 9.8% |
| XPP | Ultra China | | Pacific | 14.15 | -1.46 | 9.12 | 2.95% |
| EET | Ultra Emerging Mkts | | Emerging Markets | 49.92 | 0.05 | 4.63 | -1.84% |
| EDC | TripleBull Emerging Markets | | Emerging Markets | 28.25 | -2.27 | 4.37 | -7.15% |
| 12Stocks.com: Trading With Bearish (& Leveraged) Asia-Pacific ETFs | |
| Traders and speculators can hedge or take advantage of market pullbacks by betting on bearish (inverse) ETFs that move in opposite direction to underlying index. Asia-Pacific traders can enhance their performances by trading leveraged bearish ETFs that double or triple inverse the daily returns of Asia-Pacific indexes. Also, listed below are ETFs that have exposure to Asia-Pacific economy. |
12Stocks.com Performance of Bearish (Leveraged) Asia-Pacific ETFs
| Ticker | ETF Name | Watchlist | Category | Recent Price | Change % | Weekly Change% | YTD Change% |
| EDZ | TripleShort Emerging Markets | | Emerging Markets | 11.10 | 2.60 | -4.3 | 1.29% |
| EUM | Short MSCI Emerging Markets | | Emerging Markets | 14.31 | 1.02 | -1.29 | 1.1% |
| FXP | UltraShort FTSE/Xinhua China 25 | | Pacific | 33.96 | 0.49 | -9.1 | -13.3% |
| Charts, Fundamental Data and Performances of ETFs | ||
| Click on following links to sort by: Market Cap or Company Size Performance: Year-to-date, Week and Day | |
| To view more ETFs click on next and previous arrows | ||
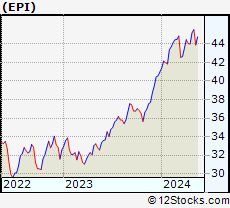 | EPI Wisdom Tree India Earnings Fund |
| Description: Tracks an earnings-weighted index of 150 Indian companies | |
| Sector: Pacific | |
| Sub-Sector: India | |
| Recent Price: 44.74 | |
| Day Percent Change: 0.09% Day Change: 0.04 | |
| Week Change: 1.66% Year-to-date Change: 9.1% | |
| EPI Links: Profile News Message Board | |
| Charts:- Daily , Weekly | |
| Save EPI for Review: | |
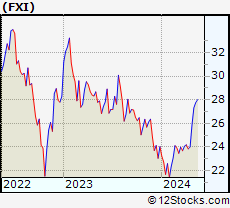 | FXI iShares China 25 |
| Description: Invests in 25 largest and most liquid Chinese companies | |
| Sector: Pacific | |
| Sub-Sector: China | |
| Recent Price: 25.18 | |
| Day Percent Change: -0.36% Day Change: -0.09 | |
| Week Change: 4.87% Year-to-date Change: 4.8% | |
| FXI Links: Profile News Message Board | |
| Charts:- Daily , Weekly | |
| Save FXI for Review: | |
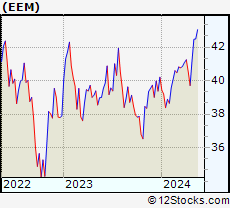 | EEM iShares Emerging Mkts |
| Description: Invests in leading companies from emerging markets like Latin America and Asia [Korea, Taiwan, etc] | |
| Sector: Emerging Markets | |
| Sub-Sector: Emerging Markets | |
| Recent Price: 40.27 | |
| Day Percent Change: -0.82% Day Change: -0.34 | |
| Week Change: 1.42% Year-to-date Change: 0.2% | |
| EEM Links: Profile News Message Board | |
| Charts:- Daily , Weekly | |
| Save EEM for Review: | |
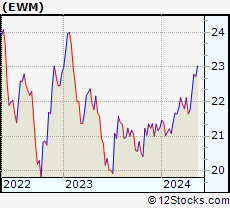 | EWM iShares Malaysia |
| Description: Invests in large cap value companies traded primarily on Kuala Lampur stock exchange & tracks MSCI Malaysia index | |
| Sector: Pacific | |
| Sub-Sector: Malaysia | |
| Recent Price: 22.03 | |
| Day Percent Change: -0.27% Day Change: -0.06 | |
| Week Change: 1.24% Year-to-date Change: 3.7% | |
| EWM Links: Profile News Message Board | |
| Charts:- Daily , Weekly | |
| Save EWM for Review: | |
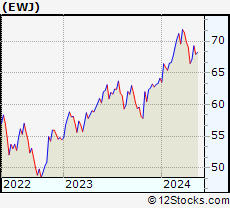 | EWJ iShares Japan |
| Description: Invests in large cap companies traded primarily on Tokyo stock exchange & tracks MSCI Japan index | |
| Sector: Pacific | |
| Sub-Sector: Japan | |
| Recent Price: 65.86 | |
| Day Percent Change: -2.59% Day Change: -1.75 | |
| Week Change: -0.95% Year-to-date Change: 2.7% | |
| EWJ Links: Profile News Message Board | |
| Charts:- Daily , Weekly | |
| Save EWJ for Review: | |
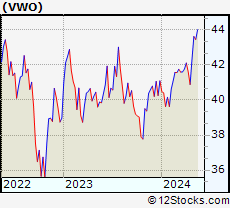 | VWO Vanguard Emerging Markets VIPERs |
| Description: Invests to track index of 500 equities from all across worlds emerging markets | |
| Sector: Emerging Markets | |
| Sub-Sector: Emerging Markets | |
| Recent Price: 41.45 | |
| Day Percent Change: -0.62% Day Change: -0.26 | |
| Week Change: 1.37% Year-to-date Change: 0.9% | |
| VWO Links: Profile News Message Board | |
| Charts:- Daily , Weekly | |
| Save VWO for Review: | |
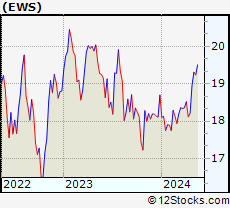 | EWS iShares Singapore |
| Description: Invests in large cap value companies traded primarily on Singapore stock exchange & tracks MSCI Singapore index | |
| Sector: Pacific | |
| Sub-Sector: Singapore | |
| Recent Price: 18.80 | |
| Day Percent Change: -0.42% Day Change: -0.08 | |
| Week Change: 3.24% Year-to-date Change: 0.5% | |
| EWS Links: Profile News Message Board | |
| Charts:- Daily , Weekly | |
| Save EWS for Review: | |
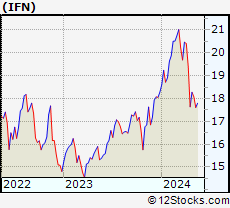 | IFN India Closed-End ETF Fund |
| Description: Invests in leading companies from India | |
| Sector: Pacific | |
| Sub-Sector: India | |
| Recent Price: 18.39 | |
| Day Percent Change: 0.57% Day Change: 0.11 | |
| Week Change: 4.22% Year-to-date Change: 0.5% | |
| IFN Links: Profile News Message Board | |
| Charts:- Daily , Weekly | |
| Save IFN for Review: | |
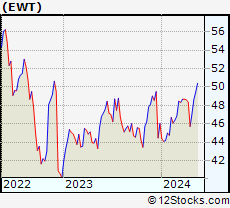 | EWT iShares Taiwan |
| Description: Invests in large cap companies traded primarily on Taiwan stock exchange & tracks MSCI Taiwan index | |
| Sector: Pacific | |
| Sub-Sector: Taiwan | |
| Recent Price: 45.88 | |
| Day Percent Change: -1.41% Day Change: -0.66 | |
| Week Change: 0.36% Year-to-date Change: -0.3% | |
| EWT Links: Profile News Message Board | |
| Charts:- Daily , Weekly | |
| Save EWT for Review: | |
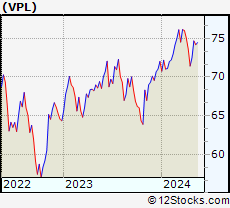 | VPL Vanguard Pacific Stock VIPERs |
| Description: Invests to track index of 400 equities from Australia, Japan, Hong Kong, New Zealand and Singapore | |
| Sector: Pacific | |
| Sub-Sector: Pacific | |
| Recent Price: 71.23 | |
| Day Percent Change: -2.02% Day Change: -1.47 | |
| Week Change: -0.27% Year-to-date Change: -1.1% | |
| VPL Links: Profile News Message Board | |
| Charts:- Daily , Weekly | |
| Save VPL for Review: | |
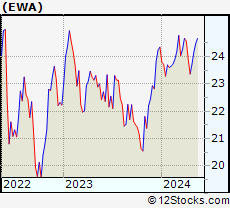 | EWA iShares Australia |
| Description: Invests in large cap companies traded in Australian stock exchange & tracks MSCI Australia index | |
| Sector: Pacific | |
| Sub-Sector: Australia | |
| Recent Price: 23.34 | |
| Day Percent Change: -1.60% Day Change: -0.38 | |
| Week Change: -0.09% Year-to-date Change: -4.1% | |
| EWA Links: Profile News Message Board | |
| Charts:- Daily , Weekly | |
| Save EWA for Review: | |
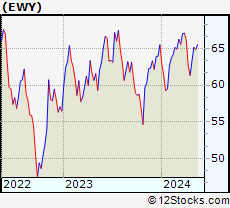 | EWY iShares South Korea |
| Description: Invests in large cap value companies traded primarily on Seoul stock exchange & tracks MSCI South Korea index | |
| Sector: Pacific | |
| Sub-Sector: Korea | |
| Recent Price: 62.05 | |
| Day Percent Change: -1.76% Day Change: -1.11 | |
| Week Change: 1.19% Year-to-date Change: -5.3% | |
| EWY Links: Profile News Message Board | |
| Charts:- Daily , Weekly | |
| Save EWY for Review: | |
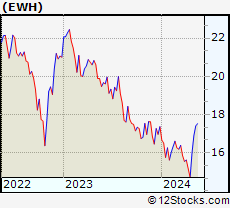 | EWH iShares Hong Kong |
| Description: Invests in large cap companies traded primarily on HongKong stock exchange & tracks MSCI Hong Kong index | |
| Sector: Pacific | |
| Sub-Sector: China | |
| Recent Price: 15.59 | |
| Day Percent Change: 0.58% Day Change: 0.09 | |
| Week Change: 6.05% Year-to-date Change: -10.3% | |
| EWH Links: Profile News Message Board | |
| Charts:- Daily , Weekly | |
| Save EWH for Review: | |
| Click on following links to sort by: Market Cap or Company Size Performance: Year-to-date, Week and Day | |
| To view more ETFs click on next and previous arrows |
| 12Stocks.com: Typical Stock Holdings in Asia-Pacific ETFs | |
| ETFs are funds that hold basket of stocks. The following table shows list of stocks or holdings commonly found in most Asia-Pacific ETFs . The funds basically perform based on what stocks they hold. You can dive deep into Asia-Pacific stocks in the following pages - Asia-Pacific Stocks |
12Stocks.com Performance of Stock Holdings in Asia-Pacific ETFs
| Ticker | Stock Name | Watchlist | Category | Recent Price | Change % | Weekly Change% | YTD Change% |
| BABA | Alibaba Group Holding Limited | | Services & Goods | 74.31 | -0.42 | 7.59 | -4.12% |
| TSM | Taiwan Semiconductor Manufacturing Company Limited | | Technology | 131.66 | -0.98 | 3.1 | 26.6% |
| TM | Toyota Motor Corporation | | Consumer Staples | 222.70 | -4.37 | -2.63 | 21.44% |
| BHP | BHP Group | | Materials | 57.26 | -3.34 | -1.48 | -16.18% |
| JD | JD.com, Inc. | | Technology | 28.19 | -0.28 | 10.51 | -2.42% |
| HMC | Honda Motor Co., Ltd. | | Consumer Staples | 33.41 | -2.91 | -2.14 | 8.09% |
| NTES | NetEase, Inc. | | Technology | 93.17 | -0.90 | -0.36 | 0.02% |
| SMFG | Sumitomo Mitsui Financial Group, Inc. | | Financials | 11.27 | -0.97 | 0.9 | 16.43% |
| INFY | Infosys Limited | | Technology | 16.87 | -1.00 | 0.36 | -8.22% |
| BIDU | Baidu, Inc. | | Technology | 98.59 | -0.60 | 3.72 | -17.21% |
| TEAM | Atlassian Corporation Plc | | Technology | 193.48 | -2.78 | 1.01 | -18.66% |
| IBN | ICICI Bank Limited | | Financials | 26.34 | 0.57 | 2.57 | 10.49% |
| TAL | TAL Education Group | | Services & Goods | 12.28 | 0.12 | 7.39 | -2.81% |
| HDB | HDFC Bank Limited | | Financials | 57.87 | -0.67 | -2 | -13.77% |
| CHT | Chunghwa Telecom Co., Ltd. | | Technology | 37.88 | -0.95 | 0.07 | -3.06% |
| MFG | Mizuho Financial Group, Inc. | | Financials | 3.85 | -1.66 | -0.13 | 11.77% |
| ZTO | ZTO Express (Cayman) Inc. | | Transports | 21.25 | 0.85 | 6.57 | -0.14% |
| EDU | New Oriental Education & Technology Group Inc. | | Services & Goods | 77.82 | 0.96 | -8.44 | 6.2% |
| YUMC | Yum China Holdings, Inc. | | Services & Goods | 38.64 | -0.41 | 4.15 | -8.93% |
| IX | ORIX Corporation | | Financials | 101.45 | -2.70 | 0.01 | 8.63% |
| NMR | Nomura Holdings, Inc. | | Financials | 5.76 | -2.45 | -0.09 | 27.83% |
| WIT | Wipro Limited | | Technology | 5.34 | -2.47 | 1.62 | -4.22% |
| VIPS | Vipshop Holdings Limited | | Services & Goods | 15.82 | 0.06 | 4.35 | -10.92% |
| HTHT | Huazhu Group Limited | | Services & Goods | 39.20 | 0.10 | 6.26 | 17.22% |
| ASX | ASE Technology Holding Co., Ltd. | | Technology | 10.11 | -2.51 | 0.6 | 7.44% |
| WB | Weibo Corporation | | Technology | 8.38 | -1.70 | 6.14 | -23.42% |
| ATHM | Autohome Inc. | | Technology | 24.98 | -0.99 | 2.88 | -10.98% |
| RDY | Dr. Reddy s Laboratories Limited | | Health Care | 73.57 | 3.74 | 3.42 | 5.73% |
| SMI | Semiconductor Manufacturing International Corporation | | Technology | 45.70 | -0.11 | -0.06 | -1.63% |
| UMC | United Microelectronics Corporation | | Technology | 7.60 | -1.30 | 2.7 | -10.17% |
| MOMO | Momo Inc. | | Technology | 5.65 | -1.91 | 1.07 | -18.71% |
| YY | JOYY Inc. | | Technology | 33.12 | -0.78 | 2.76 | -16.57% |
| MMYT | MakeMyTrip Limited | | Services & Goods | 64.75 | -1.21 | 6.32 | 37.82% |
| IMOS | ChipMOS TECHNOLOGIES INC. | | Technology | 28.16 | -0.86 | 1.24 | 3.47% |

|


List of Asia-Pacific ETFs
 |
|
US Stock Market Performance Year-to-Date: 6% |
 performance (%Change)
| Stock | Price | YTD | Week | Day% |
| EPI | 44.74 | 9.1 | 1.7 | 0.1 |
| FXI | 25.18 | 4.8 | 4.9 | -0.4 |
| EEM | 40.27 | 0.2 | 1.4 | -0.8 |
| EWM | 22.03 | 3.7 | 1.2 | -0.3 |
| EWJ | 65.86 | 2.7 | -1.0 | -2.6 |
| VWO | 41.45 | 0.9 | 1.4 | -0.6 |
| EWS | 18.80 | 0.5 | 3.2 | -0.4 |
| IFN | 18.39 | 0.5 | 4.2 | 0.6 |
| EWT | 45.88 | -0.3 | 0.4 | -1.4 |
| VPL | 71.23 | -1.1 | -0.3 | -2.0 |
| EWA | 23.34 | -4.1 | -0.1 | -1.6 |
| EWY | 62.05 | -5.3 | 1.2 | -1.8 |
| EWH | 15.59 | -10.3 | 6.1 | 0.6 |
performance (%Change) End-of-Day Market data as of
© 2014 12Stocks.com Terms & Conditions Privacy Contact Us
All Information Provided Only For Education And Not To Be Used For Investing or Trading. See Terms & Conditions
|
|
Best US Stocks |
|
Top Exchange Traded Funds (ETFs) |
|
Global Markets |
|
Best Sectors |
|
Books & More |